Locations
A complete list of sensors, with serial numbers and locations+orientations determined using a Leica Multistation (laser theodolite) is available on our wiki page (copied below). (These locations are within a few cm relative accuracy, but coarse absolute in both position and orientation and x=0,y=0 is approximately 40.211578, -88.410728, or UTM 16N 379951.119 E 4452195.001 N.)
Briefly, there were 4 primary tower sites, init (where drainage flow was thought would initiate), rel (where artificial fog was released), uconv (the upper location where there was convergent flow from a side gully), and lconv (the next lower convergence zone with a side gully). All 4 locations had a multi-level flux profile tower, either 10m or 20m tall, placed in approximately the center of the gully. rel, uconv, and lconv also had short towers about 8m on either side of their main tower to check for horizontal homogeneity across the gully flow. In addition, there were 6 sites (P1--P6) with just a barometer, in the region surrounding the gully, to determine the pressure field.
| dsm:port | did | sid | sensor | SN |
x (Easting m) |
y (Northing m) | z (MSL m) | azimuth (deg) | pitch (deg) | roll (deg) |
|---|---|---|---|---|---|---|---|---|---|---|
| initb:/dev/ttyUSB2 | 1 | 2 | Gill 2D sonic | 36.4 | ||||||
| initb:/dev/ttyUSB0 | 1 | 4 | TRH.0.2m | 17.41 | -4.69 | 217.24 | ||||
| initb:/dev/ttyUSB1 | 1 | 10 | CSAT3A+EC150 (EC100).1.5m | P1003; 1276; 1312 | 15.88 | -6.73 | 218.44 | 36.3 | -0.02 | NA |
| initb:/dev/ttyUSB3 | 1 | 12 | TRH.1.5m | 17.44 | -4.63 | 218.45 | ||||
| initb:/dev/ttyUSB4 | 1 | 30 | CSAT3A (EC100).3.0m | 2035; 1814 | 15.88 | -6.72 | 219.76 | 36.8 | -0.69 | 0.86 |
| initb:/dev/gps_pty0 | 1 | 1000 | GPS | |||||||
| initb:/dev/ttyUSB8 | 1 | 1020 | Power Monitor | |||||||
| initm:/dev/ttyUSB0 | 3 | 40 | CSAT3.4.5m | 0540 | 15.60 | -7.11 | 221.00 | 36.3 | 1.20 | -1.19 |
| initm:/dev/ttyUSB2 | 3 | 42 | TRH.4.5m | 17.42 | -4.63 | 221.01 | ||||
| initm:/dev/ttyUSB1 | 3 | 60 | CSAT3A+EC150 (EC100).6.0m | 20454?; 1433; 1817 | 15.90 | -6.71 | 222.32 | 36.1 | -0.29 | -0.86 |
| initm:/dev/ttyUSB6 | 3 | 100 | CSAT3.10m | 0800 | 15.60 | -7.11 | 225.78 | 36.3 |
0.51 |
-0.61 |
| initm:/dev/ttyUSB7 | 3 | 102 | TRH.10m | 17.42 | -4.63 | 225.73 | ||||
| initm:/dev/ttyUSB8 | 3 | 1020 | Power Monitor | |||||||
| initm:/dev/gps_pty0 | 3 | 1000 | GPS | |||||||
| rel1:/dev/ttyUSB0 | 11 | 2 | Gill 2D sonic | 105.7 | ||||||
| rel1:/dev/ttyUSB2 | 11 | 4 | TRH.0.2m | TRH28 | 313.62 | 18.71 | 214.28 | |||
| rel1:/dev/gps_pty0 | 11 | 1000 | GPS | |||||||
| rel1:/dev/ttyUSB1 | 11 | 1110 | CSAT3A (EC100).1.5m.aux1 | 309.87 | 15.02 | 215.60 | 106.94 | 0.14 | -0.24 | |
| rel1:/dev/ttyUSB3 | 11 | 1112 | TRH.1.5m.aux1 | 312.37 | 14.24 | 215.60 | ||||
| rel1:/dev/ttyUSB7 | 11 | 0x8000 | NR01+soils.c (corn) |
mote32 NR24; TS32; HF23/HF14; QS15/QS14(Teardown); TP28 |
||||||
| rel2:/dev/ttyUSB0 | 12 | 10 | CSAT3A+EC150 (EC100).1.5m | 2046; 1389;1702 | 311.03 | 19.39 | 215.50 | 105.44 | -1.09 | 1.34 |
| rel2:/dev/ttyUSB2 | 12 | 12 | TRH.1.5m | 313.55 | 18.71 | 215.48 | ||||
| rel2:/dev/ttyUSB6 | 12 | 14 | Nanobarometer.1.5m | |||||||
| rel2:/dev/ttyUSB4 | 12 | 30 | CSAT3A (EC100).3.0m | P1005; 1800 | 311.03 | 19.40 | 216.78 | 105.73 | -0.27 | 1.14 |
| rel2:/dev/gps_pty0 | 12 | 1000 | GPS | |||||||
| rel2:/dev/ttyUSB3 | 12 | 1212 | TRH.1.5m.aux2 | 312.17 | 23.90 | 215.72 |
|
|||
| rel2:/dev/ttyUSB5 | 12 | 1214 | CSAT3.1.5m.aux2 |
309.74 |
24.55 | 215.80 | 103.49 | -0.31 | -1.75 | |
| relm:/dev/ttyUSB0 | 13 | 40 | CSAT3.4.5m | 0536 | 310.59 | 19.53 | 218.12 | 105.62 | 0.74 | -0.46 |
| relm:/dev/ttyUSB2 | 13 | 42 | TRH.4.5m | 313.55 | 18.70 | 218.12 | ||||
| relm:/dev/ttyUSB1 | 13 | 60 | CSAT3A+EC150 (EC100).6.0m | 1009; 1387; 1700 | 311.04 | 19.41 | 219.40 | 105.78 | -0.31 | 0.56 |
| relm:/dev/ttyUSB4 | 13 | 80 | CSAT3.8.5m | 0538 | 310.60 | 19.54 | 221.19 | 106.01 | 0.81 | -0.98 |
| relm:/dev/ttyUSB5 | 13 | 82 | TRH.8.5m | 313.55 | 18.69 | 221.18 | ||||
| relm:/dev/ttyUSB6 | 13 | 100 | CSAT3.10m | 0537 | 310.60 | 19.54 | 223.18 | 106.03 | 0.99 | -1.22 |
| relm:/dev/gps_pty0 | 13 | 1000 | GPS | |||||||
| relt:/dev/ttyUSB0 | 14 | 150 | CSAT3.15m | 0677 | 310.59 | 19.53 | 227.52 | 105.31 | 0.28 | -1.40 |
| relt:/dev/ttyUSB2 | 14 | 152 | TRH.15m | 313.55 | 18.70 | 227.47 | ||||
| relt:/dev/ttyUSB1 | 14 | 200 | CSAT3A+EC150 (EC100).20m | P1006; 13286?; 1704 | 311.04 | 19.42 | 231.67 | 105.27 | -1.95 | -0.18 |
| relt:/dev/ttyUSB3 | 14 | 202 | TRH.20m | 313.55 | 18.68 | 231.68 | ||||
| relt:/dev/ttyUSB4 | 14 | 204 | Nanobarometer.20m | 123998 | ||||||
| relt:/dev/gps_pty0 | 14 | 1000 | GPS | |||||||
| relt:/dev/ttyUSB8 | 14 | 1020 | Power Monitor | |||||||
| relt:/dev/ttyUSB5 | 14 | 0x8000 | NR01.20m | NR26 | ||||||
| uconv1:/dev/ttyUSB2 | 21 | 2 | Gill 2D sonic |
1422017 1536012 replaced with 1335016 on 23 Oct |
131 | |||||
| uconv1:/dev/ttyUSB0 | 21 | 4 | TRH.0.2m | 460.30 | -48.67 | 212.53 | ||||
| uconv1:/dev/gps_pty0 | 21 | 1000 | GPS | |||||||
| uconv1:/dev/ttyUSB8 | 21 | 1020 | Power Monitor | |||||||
| uconv1:/dev/ttyUSB1 | 21 | 1110 | CSAT3A (EC100).1.5m.aux1 | 454.06 | -52.34 | 213.87 | 130.15 | 0.14 | 0.16 | |
| uconv1:/dev/ttyUSB3 | 21 | 1112 | TRH.1.5m.aux1 | 456.06 | -54.03 | 213.86 | ||||
| uconv2:/dev/ttyUSB0 | 22 | 10 | CSAT3A+EC150 (EC100).1.5m | P1010; 1467; 1818 | 458.32 | -46.94 | 213.64 | 131.19 | -0.23 | -0.01 |
| uconv2:/dev/ttyUSB2 | 22 | 12 | TRH.1.5m | 460.30 | -48.66 | 213.71 | ||||
| uconv2:/dev/ttyUSB4 | 22 | 30 | CSAT3A (EC100).3.0m | 2036; 1822 | 458.32 | -46.95 | 215.01 | 131.12 | -0.48 | 0.86 |
| uconv2:/dev/gps_pty0 | 22 | 1000 | GPS (currently disabled) | |||||||
| uconv2:/dev/ttyUSB1 | 22 | 1210 | CSAT3A (EC100).1.5m.aux2 | 462.03 | -40.77 | 213.75 | 131.80 | -0.03 | -0.48 | |
| uconv2:/dev/ttyUSB3 | 22 | 1212 | TRH.1.5m.aux2 | 463.98 | -42.50 | 213.75 | ||||
| uconv2:/dev/ttyUSB7 | 22 | 0x8000 | NR01+soils.g (grass) |
mote31 NR25; TS30/TS23?(Teardown); HF17; QS29; TP33 |
||||||
| uconvm:/dev/ttyUSB0 | 23 | 40 | CSAT3.4.5m | 0855 | 457.96 | -46.65 | 216.29 | 130.56 | 0.22 | 0.17 |
| uconvm:/dev/ttyUSB2 | 23 | 42 | TRH.4.5m | 460.30 | -48.66 | 216.25 | ||||
| uconvm:/dev/ttyUSB1 | 23 | 60 | CSAT3A+EC150 (EC100).6.0m | 2037; 1385; 1813 | 458.30 | -46.96 | 217.81 | 130.62 | 0.03 | 0.92 |
| uconvm:/dev/ttyUSB6 | 23 | 100 | CSAT3.10m | 1120 | 457.97 | -46.63 | 221.04 | 131.29 | 0.86 | -1.71 |
| uconvm:/dev/ttyUSB7 | 23 | 102 | TRH.10m | 460.27 | -48.68 | 221.08 | ||||
| uconvm:/dev/gps_pty0 | 23 | 1000 | Power Monitor | |||||||
| uconvm:/dev/ttyUSB8 | 23 | 1020 | GPS | |||||||
| lconv1:/dev/ttyUSB2 | 31 | 2 | Gill 2D sonic | 52.5 | ||||||
| lconv1:/dev/ttyUSB0 | 31 | 4 | TRH.0.2m | 593.46 | -132.97 | 211.19 | ||||
| lconv1:/dev/gps_pty0 | 31 | 1000 | GPS | |||||||
| lconv1:/dev/ttyUSB1 | 31 | 1110 | CSAT3A+EC150 (EC100).1.5m.aux1 | 589.40 | -139.21 | 212.56 | 51.63 | 0.16 | 1.01 | |
| lconv1:/dev/ttyUSB3 | 31 | 1112 | TRH.1.5m.aux1 | 591.46 | -137.59 | 212.56 | ||||
| lconv2:/dev/ttyUSB0 | 32 | 10 | CSAT3A (EC100).1.5m | P1008; 1388; 1694 | 591.41 | -134.54 | 212.43 | 51.58 | -0.22 | 0.04 |
| lconv2:/dev/ttyUSB2 | 32 | 12 | TRH.1.5m | 593.46 | -132.97 | 212.44 | ||||
| lconv2:/dev/ttyUSB6 | 32 | 14 | Nanobarometer.1.5m | |||||||
| lconv2:/dev/ttyUSB4 | 32 | 30 | CSAT3A (EC100).3.0m | P1001; 1810 | 591.39 | -134.56 | 213.61 | 52.31 | -0.51 | 0.52 |
| lconv2:/dev/gps_pty0 | 32 | 1000 | GPS | |||||||
| lconv2:/dev/ttyUSB1 | 32 | 1210 | CSAT3A (EC100).1.5m.aux2 | 2044->2045 on 27 Oct | 593.35 | -129.90 | 212.61 | 49.54 | -0.22 | -1.14 |
| lconv2:/dev/ttyUSB3 | 32 | 1212 | TRH.1.5m.aux2 | 595.35 | -128.21 | 212.60 | ||||
| lconv2:/dev/ttyUSB7 | 32 | 0x8000 | NR01+soils.b (soybeans) |
mote21 TS26; Q33; HF01; TP29 |
||||||
| lconvm:/dev/ttyUSB0 | 33 | 40 | CSAT3.4.5m | 1119 | 591.01 | -134.83 | 214.98 | 52.78 | 0.65 | -0.69 |
| lconvm:/dev/ttyUSB2 | 33 | 42 | TRH.4.5m | 593.47 | -132.97 | 214.97 | ||||
| lconvm:/dev/ttyUSB1 | 33 | 60 | CSAT3A+EC150 (EC100).6.0m | P1002; 1384; 1696 | 591.38 | -134.56 | 216.30 | 52.57 | -0.59 | 0.45 |
| lconvm:/dev/ttyUSB4 | 33 | 80 | CSAT3.8.5m | 0853 | 591.00 | -134.82 | 218.11 | 53.02 | 0.58 | -0.87 |
| lconvm:/dev/ttyUSB5 | 33 | 82 | TRH.8.5m | 593.47 | -132.98 | 218.10 | ||||
| lconvm:/dev/ttyUSB6 | 33 | 100 | CSAT3.10m | 0678 | 591.00 | -134.82 | 220.11 | 53.14 | 0.74 | -0.15 |
| lconvm:/dev/gps_pty0 | 33 | 1000 | GPS | |||||||
| lconvm:/dev/ttyUSB8 | 33 | 1020 | Power Monitor | |||||||
| lconvt:/dev/ttyUSB0 | 34 | 150 | CSAT3.15m | 1124 | 591.00 | -134.81 | 224.40 | 52.87 | 0.96 | -1.30 |
| lconvt:/dev/ttyUSB2 | 34 | 152 | TRH.15m | 593.42 | -133.02 | 224.45 | ||||
| lconvt:/dev/ttyUSB1 | 34 | 200 | CSAT3A+EC150 (EC100).20m | 2031; 1277; 1313 | 52.31 | -1.44 | -0.17 | |||
| lconvt:/dev/ttyUSB3 | 34 | 202 | TRH.20m | 593.50 | -132.99 | 228.60 | ||||
| lconvt:/dev/ttyUSB4 | 34 | 204 | Nanobarometer.20m | 122850 | ||||||
| lconvt:/dev/gps_pty0 | 34 | 1000 | GPS | |||||||
| lconvt:/dev/ttyUSB8 | 34 | 1020 | Power Monitor | |||||||
| lconvt:/dev/ttyUSB5 | 34 | 0x8000 | NR01.20m | NR2783 | ||||||
| p1:/dev/ttyUSB0 | 41 | 158 | PTB220 | 50610003 | ||||||
| p1:/dev/gps_pty0 | 41 | 1000 | GPS | |||||||
| p1:/dev/ttyUSB8 | 41 | 1020 | Power Monitor | |||||||
| p2:/dev/ttyUSB0 | 42 | 158 | PTB220 | NCAR0001 | ||||||
| p2:/dev/gps_pty0 | 42 | 1000 | GPS | |||||||
| p2:/dev/ttyUSB8 | 42 | 1020 | Power Monitor | |||||||
| p3:/dev/ttyUSB0 | 43 | 158 | PTB220 | 4110001 | ||||||
| p3:/dev/gps_pty0 | 43 | 1000 | GPS | |||||||
| p3:/dev/ttyUSB8 | 43 | 1020 | Power Monitor | |||||||
| p4:/dev/ttyUSB0 | 44 | 158 | PTB220 | 50610001 | ||||||
| p4:/dev/gps_pty0 | 44 | 1000 | GPS | |||||||
| p4:/dev/ttyUSB8 | 44 | 1020 | Power Monitor | |||||||
| p5:/dev/ttyUSB0 | 45 | 158 | PTB220 | 4110003 | ||||||
| p5:/dev/gps_pty0 | 45 | 1000 | GPS | |||||||
| p5:/dev/ttyUSB8 | 45 | 1020 | Power Monitor | |||||||
| p6:/dev/ttyUSB0 | 46 | 158 | PTB220 | 4110004 | ||||||
| p6:/dev/gps_pty0 | 46 | 1000 | GPS | |||||||
| p6:/dev/ttyUSB8 | 46 | 1020 | Power Monitor |
General Comments
There was a lot of animal (mouse, rabbit, deer) activity during this experiment, which primarily impacted deployment of the PI's DTS fiber-optic temperature sensing system. ISFS cables that were not our green cable (ethernet and soil sensors) suffered some damage. We learned to encase these in hard plastic sleeves, but not before loosing some data.
Power was the biggest issue for our system. ISFS used solar power at all sites, but field staff were kept busy reconfiguring these power systems to provide adequate power for each of the heavily-instrumented towers. After extensive testing both in the field and later in the lab, it appears that the charge controllers were not optimal for the batteries we were using. This combination of controller and battery had been used successfully by ISFS for over a decade, but may never have been pushed to this extreme of poor solar input (cloudy, in the fall), and large load. (ISFS has since changed to a MPPT charge controller and LiPO batteries.) As a result, several hours of night-time (primarily early-morning) data often were lost at individual towers. Fortunately, most of these outages did not overlap with project IOPs.
Events
16 Sep: Operations started
25 Sep, 9PM: gust front came through site
2 Oct: Sensor cleaning and gravimetric soil sampling
7 Oct: More soil cores (after heavy rain the day before)
11 Oct: corn harvested
13 Oct: cleaned sensors
19-20 Oct: soybeans harvested
22 Oct: cleaned sensors
24 Oct: took soil samples
15 Nov: Operations end
Sensors
Radiometer
NR01 integrated 4-component radiometers were used to measure the 3 dominant land cover types: corn (.c), soybeans (.b), and grass (.g, in the gully). These were mounted on our camera tripods at approx 2.2m (corn), 1.5m (soybeans), and 0.7m (grass), to obtain a reasonable footprint, though the corn sensor probably ended up below the corn tassels. These sensors worked as expected and no data quality issues were noted, however data have been removed when our leaf wetness sensor indicated moisture on the surface. Specific notes:
nr01.20m.rel mote cable became disconnected. Fixed 23 Sep.
Hukseflux NR01 Issue First Documented Wed, Dec 23, 2020.
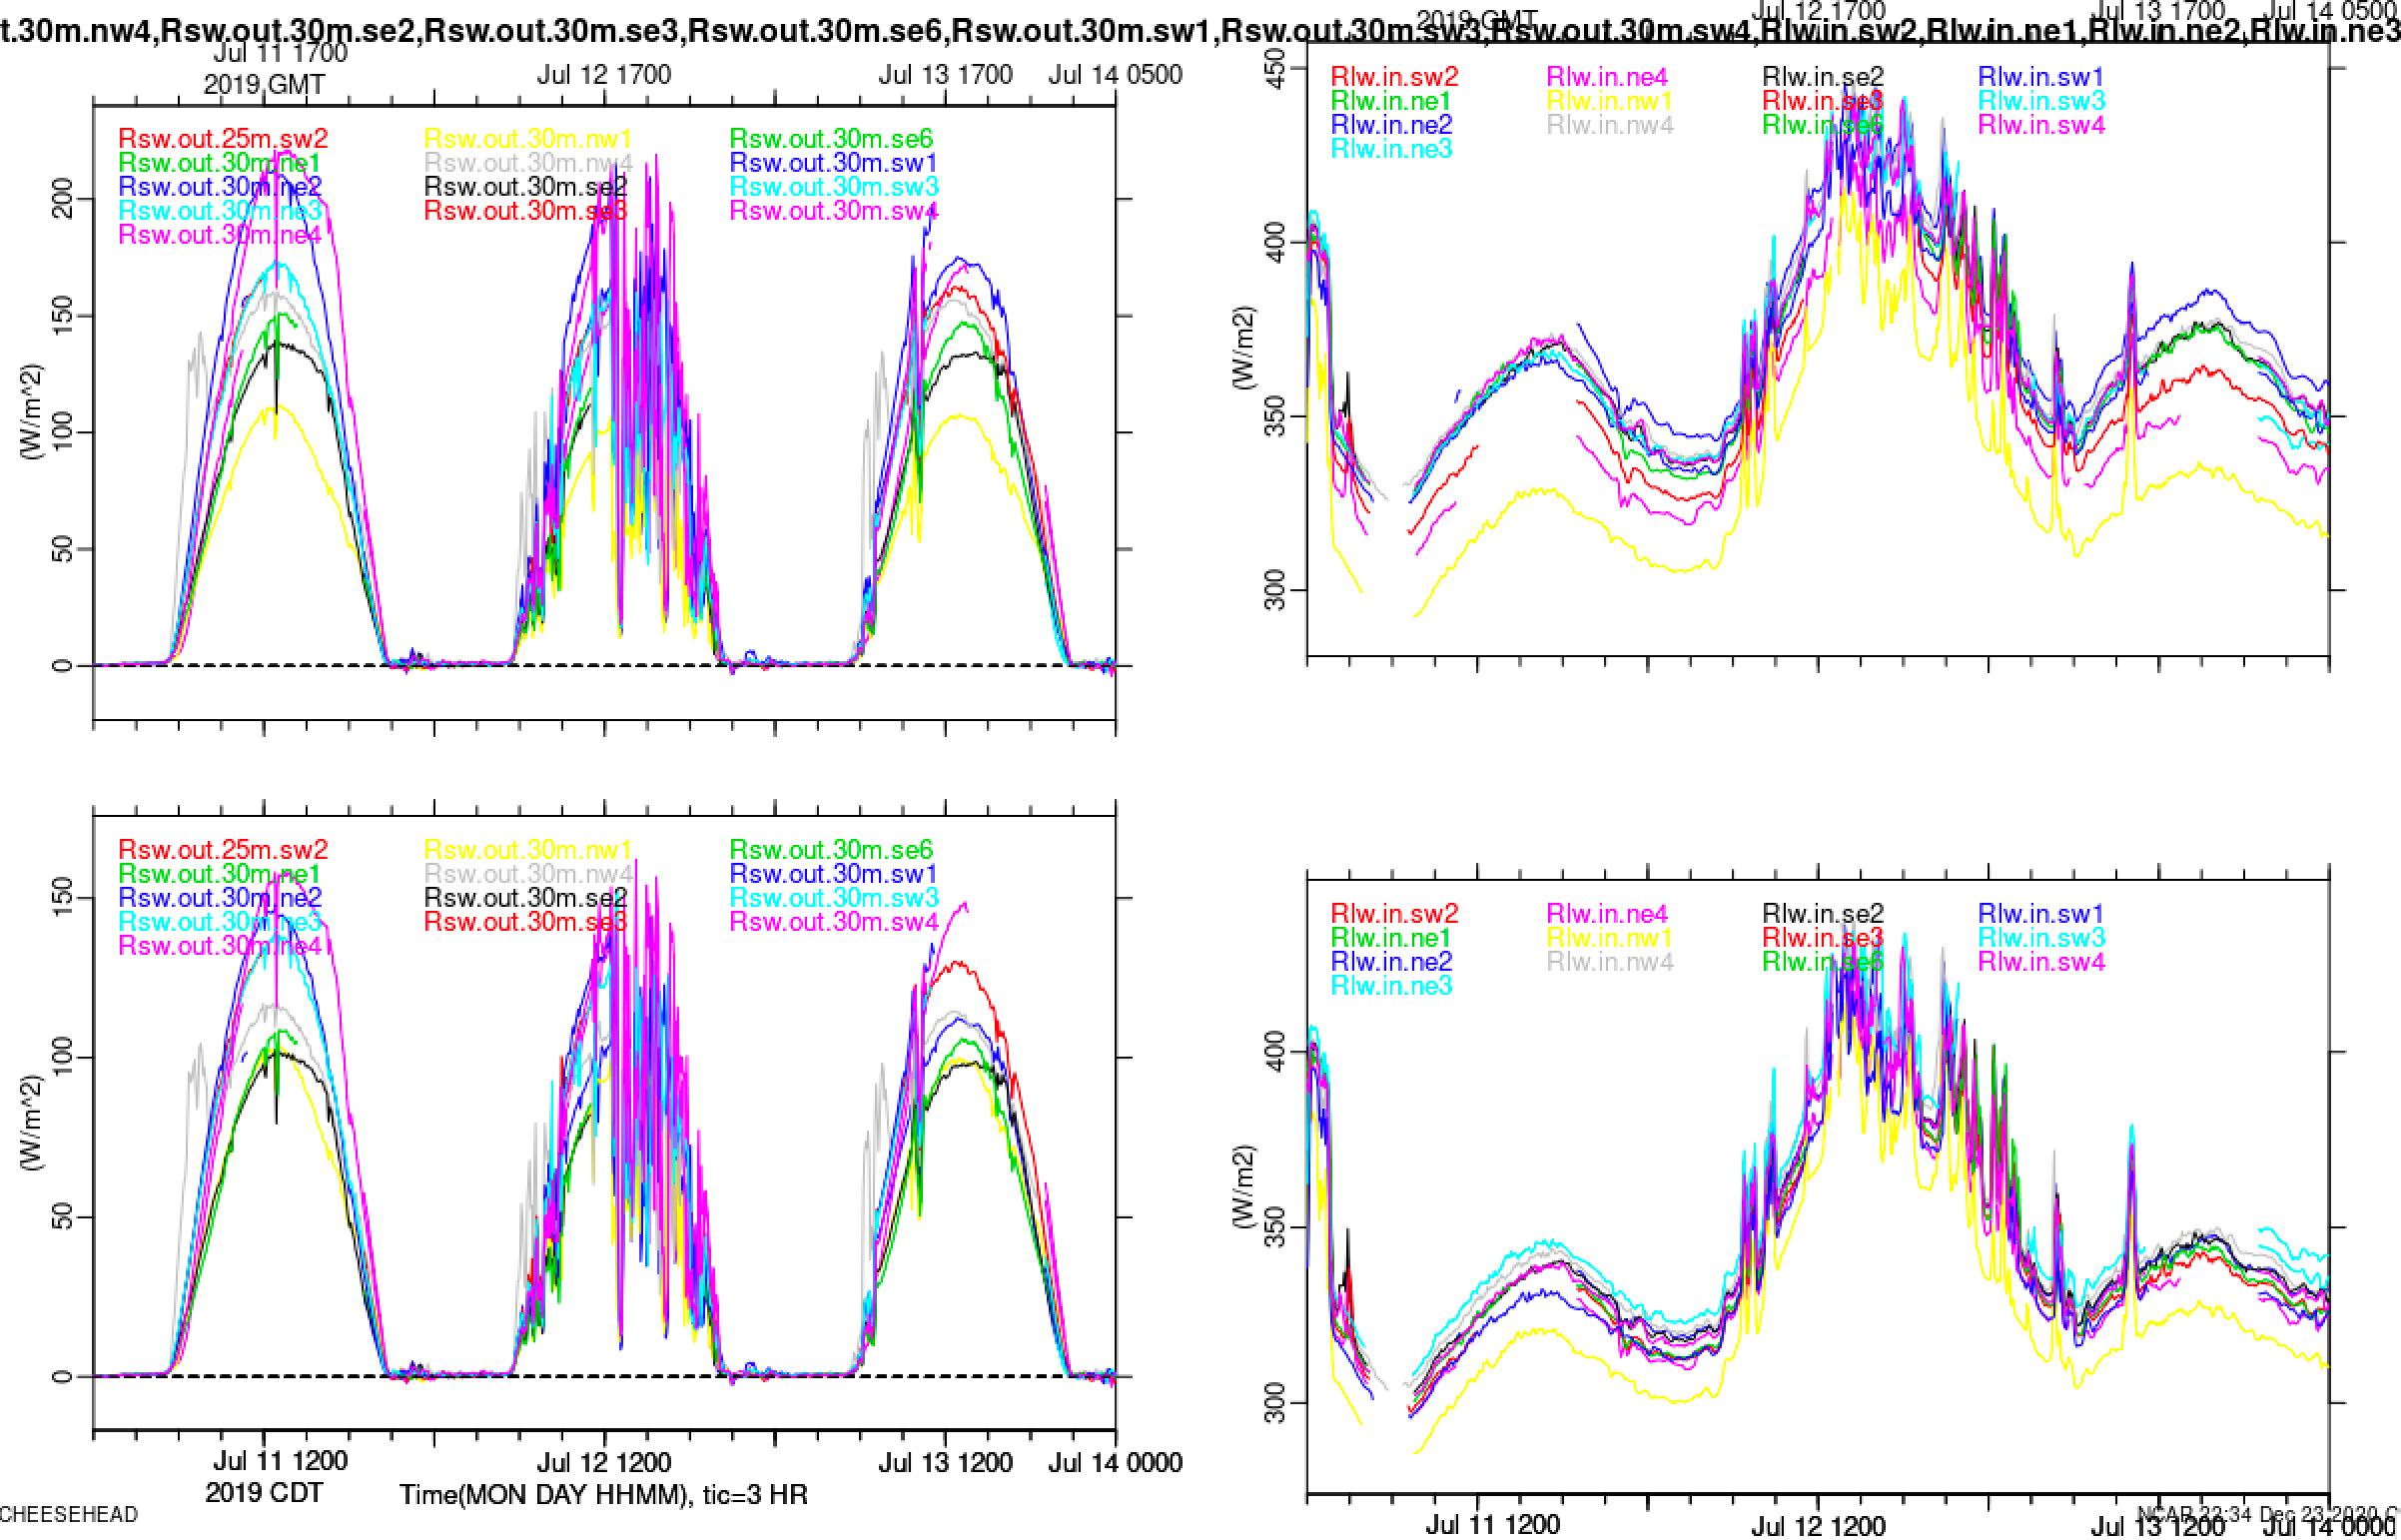
An error was discovered in the NR01 radiometer measurements. Coefficients provided by the manufacturer and unique to each sensor were swapped for the Rsw.out (outgoing shortwave radiation) and Rpile.in (radiant heat within the radiometer dome) parameters. This also affects the derived parameters Rlw.in (incoming longwave radiation) and Rsum (the total of all 4 components) - refer to https://www.eol.ucar.edu/node/1935 for the calculation. The plot below is a test example from the CHEESEHEAD campaign with the upper left Rsw.out and upper right Rlw.in before correction, and the bottom row after correcting for this switch.
Sensors with serial numbers greater than 14 are affected and require correction, i.e. apply the correct coefficients for Rsw.out and Rpile.in parameters and update the measured values, including derived Rlw.in and Rsum. Refer to the Table below for a list of the site, associated NR01 serial number, and whether corrections are required.
These measurements have been corrected for the 5-minute averaged data files (now version 2.0), and are available at the EOL Field Data Archive: https://doi.org/10.26023/NKWR-EYWS-5J0W
| Site | NR01 Serial Number |
Requires Coeffient Correction? |
|---|---|---|
| Rel - corn | 24 | Yes |
| Rel - 20 m | 26 | Yes |
| Uconv - grass | 25 | Yes |
| Lconv - soybeans | 29 | Yes |
| Lconv - 20 m | 19 | Yes |
2-D Sonic anemometer
Gill WindObservers were deployed upside-down ("flipped") to measure wind speed close to the surface (0.2m). Mounting upside down allowed water to enter the connector of the sensor at uconv, which caused us to lose some data. We also had to write new code to accommodate this orientation. Also, due to the inverted orientation of the Gills we were unable to accurately measure their azimuth with the Multistation, instead relying on averaging the azimuths of the above 3D sonics to estimate orientation.
- 0.2m.init needed DSM power cycle 20 Oct
- 0.2.uconv needed to be replaced due to corrosion on 23 Oct
3-D Sonic anemometer
CSAT3AW sonic anemometers were used for turbulence measurements on all gully towers. Some reported a poor sonic signal. It was determined that a factory quality parameter was set too tight. Adjusting this parameter solved this issue. The missing data cannot be recovered. Specific notes:
- csat.10m.uconv had bad data rate until reconfigured 20 Sep. The data before this point has been removed.
- csat.6m.init dead on 21 Sep.
- csat.1.5m.rel died 24 Sep., fixed 27 Sep. with parameter change
- csat.15m.rel needed DSM reset on 8 Oct
- csat.10m.rel needed new cable on 8 Oct
- csat.1.5m.a2.lconv was down during the day of 20 Oct, but restarted itself
- csat.3m.lconv was down, but fixed itself on 26 Oct
- csat.1.5m.lconv.a2 intermittent, replaced on 27 Oct
- csat.1.5m.uconv2 intermittent, fixed itself 1 Nov (should be lconv??)
- csat.1.5m.lconv.a2 ec100 replaced on 2 Nov
H2O/CO2 IRGA
CSAT EC-150 infrared absorption gas analyzers were used for H2O and CO2. Field staff noted very large CO2 values at night early in the project, as respired air built up in the gully, that probably are real. These sensors did have some short-duration resets that may have been related to power availability. Also, frequent dew formation at night caused readings to be overly high. In the 5-minute averages, we have not removed data based on wetness sensor values, but could do so in the future. For the high-rate data files, we have implemented a filter removing data when the 5min average h2o deviates by more than 2 g/kg from the mean of the TRH H2O values. This conservative filter still has some values that clearly are not correct, especially as the dew forms. Finally, some obvious spikes in Pirga were removed by imposing a lower limit.
Specific notes:
- ec150.1.5m.lconv had a bad EC100 configuration (only CSAT) until 20 Sep.
TRH
Each tower used NCAR temperature/relative humidity sensors for vertical profiles. This version had housings in which the fans were direct connected to the power line (the old fan controller electronics were removed, i.e.. "bypassed"). This makes it difficult to know when a fan dies, which did happen several times during the project. Some specific notes:
- trh.0.2m.rel had a loose SHT sensor that was fixed 19 Sep. The data have been removed before then.
- trh.10m.init also had a loose SHT sensor that was fixed 20 Sep. The data have been removed before then.
- trh.15m.lconv and trh.20m.lconv SHT sensors weren't installed until 20 Sep.
- trh.8.5m.rel dead until RS232/485 jumpering changed on 23 Sep.
- trh.4.5m.rel noisy fan replaced 29 Sep. No data issues were identified before this.
- trh.0.2m.init needed DSM reboot on 12 Oct. A small period of trh.1.5m.init data was removed after this.
- trh.15m.rel had several periods of bad RH until 6 Oct. Multiple periods have been removed.
- trh.15m.rel replaced housing with noisy fan 17 Oct.
- trh.10m.uconv fan died sometime around 31 Oct. The housing was replaced on 3 Nov. and a couple of hours of data have been removed on 31 Oct. We could not justify removing any additional data during this period.
- trh.20m.rel housing replaced on 3 Nov. No data issues were identified before this.
- trh.4.5m.uconv housing replaced on 4 Nov, but the fan could have been bad since 1 Nov. We could only justify removing a period of data from 05-15 CST on 2 Nov. This temperature had been noted as running a bit high (warmest on the tower each day) since the beginning of the campaign, but this had not been consistent around the time of the fan's failure.
- 7 Nov: many fans seem to be running rough, but no spares were available.
- trh.0.2m.rel fan failed around 4 Nov. and was swapped with trh.1.5m.aux2 on 7 Nov. These data have been removed. Aux2 data has not been removed, as the fan was revived after switch.
- trh.1.5m.init housing was replaced due to bad fan on 10 Nov., however we could not determine when the fan failed and could not justify removing any data prior to this point.
- trh.20m.rel was replaced again on 11 Nov. due to a bad fan. Temps were very high after 6 Nov. so we have removed this period from the TRH data.
- trh.8.5m.rel was bad after 23 Nov. and has been removed.
- trh.4.5m.init had a bad RH between 22-24 Nov. and has been removed.
- trh.20m.rel and trh.15m.rel both showed bad RH values between 25-27 Nov. that have been removed.
Soil sensors
Our standard set of soil sensors were used to measure the top 5cm of soil at each of the radiometer sites.
All soybean soil sensors were disconnected on 18--20 Oct for harvesting operations.
Tsoil: NCAR soil temperature profiles were used to measure 4 levels from 0--5cm depth.
- Tsoil.1.9cm.g had problems of an unidentified origen throughout the campaign and have been removed from the dataset.
- All 4 tsoil depths in the grass (uconv gully) were bad until 23 Sep. The period before this has been removed.
Qsoil: Decagon (now METER) EC-5 soil moisture probes were deployed at 5cm (having learned that 2.5cm was too high). These were periodically checked by taking gravimetric soil moisture readings.
- Qsoil.b starts reading over 100% on Oct 6. These data remain in the dataset, but look suspicious in early Oct.
- Qsoil.c becomes a fuzzy after mid Oct. These data have not been removed because their values do look reasonable, but should be used with caution.
- Qsoil.b goes bad, showing values below 0 after 26 Oct. All data after this point have been removed.
Gsoil: REBS heat flux plates were deployed at 5cm to measure the soil heat flux, that will be corrected to a surface value using the Tsoil and TP01 data. These worked as expected and no data issues were identified.
TP01: Hukseflux TP01 soil thermal properties probes were deployed at 2.5cm to determine the heat capacity. These worked as expected and no data issues were identified.
Barometer
A mix of 4 different types of sensors were deployed, listed here in decreasing order of accuracy:
- Paroscientific nanobarometers at 1.5m & 20m.rel and 1.5m and 20m.lconv.
- Vaisala PTB220 digital barometers at P1-6
- Vaisala PTB110 analog barometers internal to the Campbell EC150 H2O/CO2 analyzers at 1.5m, 6m, &20m.rel and 1.5m, 6m, and 20m.lconv
- Solid-state barometers internal to the Campbell EC150 H2O/CO2 analyzers at 1.5m &6m.init and 1.5m &6m.uconv
The nanobarometers were connected to All-Weatther quad-disk probes and appeared to work normally.
The PTB220 barometers were connected to our PAM single-disk pressure ports at each of the 6 outlying pressure sites. All pressure sensors worked as expected. The only issue was when the P6 pressure tubing was found disconnected and fixed on 11 Nov. We were unable to determine precisely when this occurred, however we suspect it happened around 05 CDT on 26 Oct. We have removed a few outliers in the data between this time and 12 CDT on 11 Nov., but are not confident enough to justify removing all of the data during this period. Thus these data should be used with caution.
Both the PTB110 and solid-state barometers are not really intended as primary pressure sensors, they are present so that the EC150 can compute air density for use in the calculation of gas density. Hence, our labeling of these data as "Pirga", rather than "P". Their inlet is a sintered metal frit on the bottom of the EC150's electronics box, surrounded by cables. Adjustments (e.g. bias correction, despiking) may be necessary to use these data,
