Introduction
Sonic anemometers were deployed at the Big Bear Solar Observatory, California, and at Haleaka, Hawaii in support of the Advanced Technology Solar Telescope site survey during Summer 2004. Deployment and operations for this study were done by NSO staff, using a duplicate of the ISFF data system. ISFF provided some data management support.
Other Links
- Initial deployment at the Boulder Atmospheric Observatory to compare methods
- Advanced Technology Solar Telescope
- Big Bear Solar Observatory
- Mees Solar Observatory at Haleakala, Maui, Hawaii
Chronology
- May 5, 2004 to June 14, 2004: System installed and taking data at Big Bear.
- June 30, 2004 to August 8, 2004: System installed and taking data at Haleakala.
Site Description
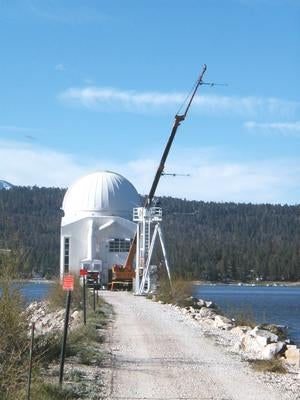
Big Bear
Here is a vertical diagram of the anemometer layout. The anemometer heights are 7.3, 13.0, and 23.0m above the causeway which is 4.9m above the mean water surface. Mark Komsa also sent this message about the horizontal layout: "The Big Bear dome building itself is 31' 8" square and 30' 1.5" in height. The dome structure by itself is 30' in diameter and 15' 7" in height. The total height of the building with dome is 45' 8.5". The crane boom sensors are located 37 feet away from the dome building. The tower mounted sensor is located 73 feet away from the crane boom." Thus, the horizontal displacement of the upper anemometers from the observatory building is about 1 building cross-section and the lowest is another 2 building cross-sections away. The anemometers are at heights about 1.5, 2.6, and 4.7 times the vertical step of the cross-section. We note that flow is usually perpendicular to the causeway. Thus, it is reasonable that the flow would be affected by these structures, which probably explains the observed "tilts" of the flow of 11, 10, and 6 degrees, respectively, with increasing height.
Haleakala
A similar set-up was used at Haleakala. A diagram of the crane set-up is here. Also see photographs below.
Tilt plots for Haleakala (6m, 15m, 25m) show pitch angles of about -1, -2, and -5, respectively and roll angles of about +3, +2, and +4 degrees. Presumably most of this "tilt" was due to the terrain (and the effect could change with height), though some droop on the crane could have occurred.
Both
Most data are still in instrument coordinates to facilitate the high-frequency data corrections for path averaging. The azimuth of the anemometer booms were 317.8, 242.3, and 242.3 degrees for 6, 15, and 25m respectively at Big Bear and 37 degrees for all anemometers at Haleakala.
Photographs
Data Plots
Click to see QC Plots
Data Download
The ATST site survey data is available for download in the following form:
- NetCDF files with 5-minute averages of all statistics (See list of variables to interpret.)


