OHATS
Ocean Horizontal Array Turbulence Study
 Introduction

This document describes the operation and measurements of the Integrated Surface Flux System (ISFS) during the Ocean Horizontal Array Turbulence Study (OHATS) field project in 2004.
Principle Investigators for the project are Peter P. Sullivan (MMM/NCAR), James B. Edson (WHOI), John C. Wyngaard (Penn State University), Thomas W. Horst (ATD/NCAR), Donald H. Lenschow (MMM/NCAR), Chin-Hoh Moeng (MMM/NCAR), and Jeffery C. Weil (CIRES, University of Colorado). Participation by James B. Edson and John C. Wyngaard has been funded by a grant from the National Science Foundation.
Sonic Array Design
The OHATS sonic array design was changed from that used during the HATS field project, based on the experience gained during the data analysis phase of HATS. These changes were the use of nine sonics in both of the two, vertically-displaced lines of sonics and a smaller vertical spacing between the two lines. Click on the link for discussion of the reasons for these changes and the results of a pre-project flow distortion test of the new array design.
Schedule
- April 1st - July 23rd
- Pre-project testing at NCAR
- July 25th - August 3rd
- Deployment of sonic anemometer array on WHOI ASIT south of Martha's Vineyard
- August 3rd - October 26th
- Operations
- October 26th
- Sensors and data system removed from ASIT
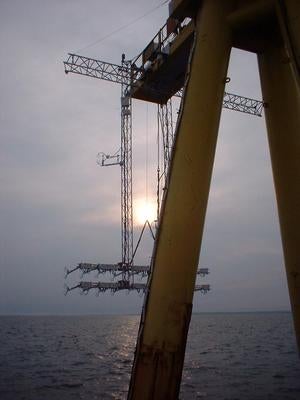
Measurement Site
Two horizontal arrays of nine CSAT3 sonic anemometers were deployed at heights of 5 and 5.58 m above msl on the Woods Hole Oceanographic Institute (WHOI) Air-Sea Interaction Tower (ASIT), 3 km south of Martha's Vineyard in 15 m of water.
Other measurements, provided by WHOI and ingested by the ISFF data system, include an independent CSAT3 sonic at a height of 9 meters, collocated with a Licor 7500 fast water vapor and CO2 sensor and a Vaisala hygrothermometer; three laser wave height sensors; and an inertial motion package, MotionPak, attached to the crosswind array.
Field Logbook
A computer-readable field logbook of comments by NCAR and other personnel is available in read-only html form. A separate logbook exists for the pre-project flow distortion tests at Marshall, CO.
Data Plots
The 5 minute statistics for most variables are shown on time-series plots for each day. The periods of the plots extend for 36 hours, from 1800 EST the preceding day until 0600 EST the following day.
Sonic Calibration and Data Corrections
The CSAT3 sonics were calibrated by the manufacturer prior to the field program. However, wind tunnel testing after the project showed offsets on the order of 10 cm/s for four of the 19 sonics.
The sonic data must be rotated to correct them for sensor tilt. Unfortunately the planar fit method, which is based on removing the mean, non-zero vertical velocity, is not applicable to this data due to flow distortion upwind of the ASIT tower. See Sonic Calibration and Data Corrections for a discussion of the wind tunnel tests and how the data have been corrected.
Other Links
Principal Investigators:
- Peter Sullivan MMM/NCAR
Project Manager:
- Tom Horst NCAR/EOL/ISF
Data Manager:
- EOL Archive, NCAR/EOL/DMS