The offical project period for S-PolKa in DYNAMO was 1-Oct-2011 through 15-Jan-2012. Prior to 1-Oct, S-Pol was in "shake-out" mode, where calibrations were still being adjusted and operations optimized. Test operations were virtually complete on 28-Sep, and data for 28-Sep through 30-Sep are considered reliable enough to be included in the archive data set.
Data collection efficiency was computed from modified timeline plots and the data used for those plots (see dynamo_data_recording.html for an explanation of the timelines). The timeline methodology was modified to consider only the sum of all times for which the data were in the final archive, and the radar transmitter showed the expected power output (thereby eliminating times when the S or Ka transmitter had faulted, but data recording continued). Data gaps of less than 40 seconds were ignored; such gaps exist between volume scans, or when the radar is waiting to re-sync to the top-of-the-hour to repeat a set of programmed scans.
The up-times for the S-PolKa system are as follows:
                S-band     96.21 %
                Ka-band    82.55 %
These are for a 110-day period, 20110928 through 20120115 (110 days, or 2640 hours). The numbers were compiled from review of all beams in both the Ka and S covariances data sets, and only including those beams where the transmit powers were (about 10dB) above the "no transmit" value. The transmit signal was used to exclude the period when the Ka reciever continued to operate and input data, despite the fact that the radar was on a bench in container 8. (Matlab code was used to plow through every data file for the project).
Major data loss for the Ka was attributable to the following causes:
The other ~3% of data loss were due to miscellaneous, not clearly defined reasons.
Note that DYNAMO was the first deployment of the Ka in its new, modified configuration, and that the Ka was never intended for 24/7 operations, with long periods of unattended ops.
The S-band losses were roughly:
Details of some outages may be found in the Field Logbook for S-PolKa.
A separate product is available that tabulates the main features of the Archive Timeline Plots. See: ???
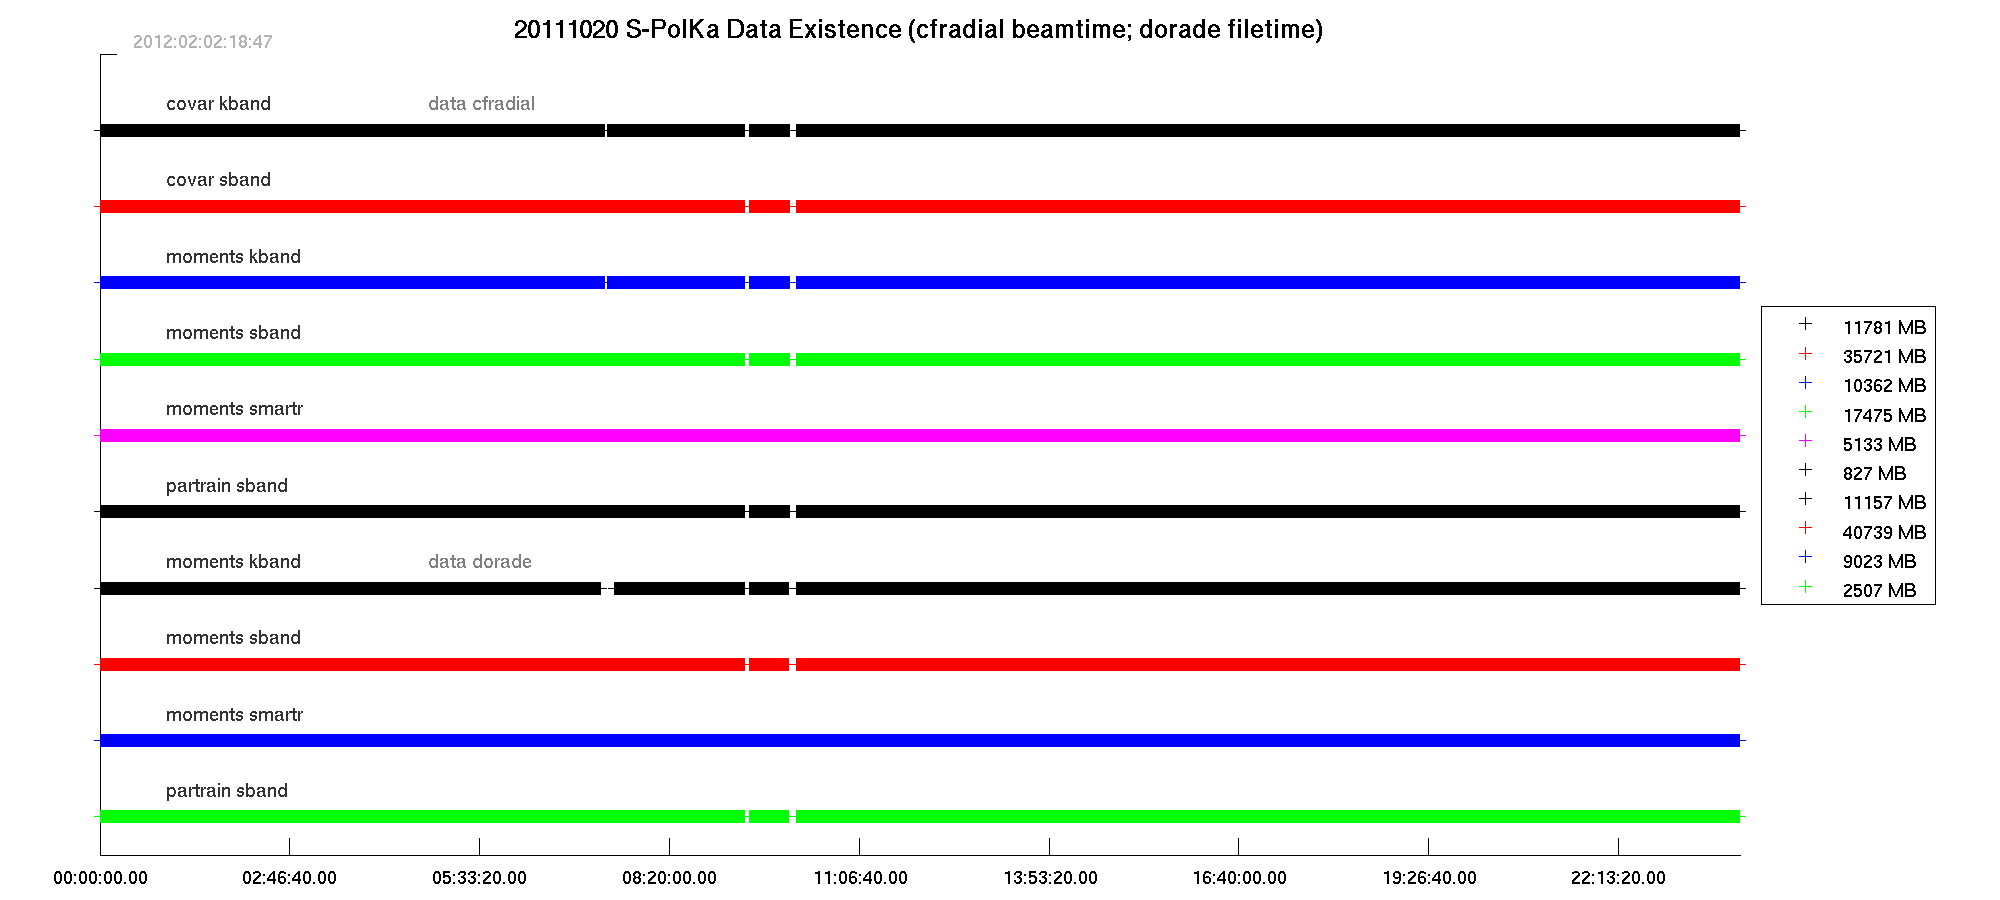
The archive timeline plots are a special case of the more general field timeline plots. The archive plots show only the S and Ka covariance time bar for the periods where the radar's transmitter was active. This eliminates periods where the transmitter may have faulted, or the period of bench-testing of the Ka after the magnetron replacement at the end of November. The transmitter filter test was applied only to the covar data sets in CfRadial format. When there is not transmit power, the timelines may still show periods where there are moment data in CfRadial or DORADE format, but the data in those files will consist of noise, only.
For purposes of determining data existence, rely mainly on the top two lines of the plots, or refer to the summary of Ops Periods in the previous section on this page.
Timelines for SMART-R data may be incomplete due to circumstances other than radar "down" time. SMART-R data were communicated to S-pol through a somewhat tenuous data link, and gaps in the SMART-R coverage may be a reflection of failed communications, rather than radar outage. Also note that SMART-R data are not distributed by NCAR, and were archived only as a backup for the Texas A and M recording process.
The complete set of timelines for archived data are found here.
