The S-Pol antenna is balanced and tuned for performance at the start of every field project. Tuning ensures that the antenna can point in the desired direction, and closely follow the intended scan program. A tuned antenna is more responsive to commands and minimizes the time required to complete a full volume scan.
As part of the tuning operation, plots of azimuth and elevation, or azimuth versus beam number are created. The plots clearly identify any problems with antenna scanning. For DYNAMO, plots were created using Matlab with input files consisting of both the K-band and S-band covariance data sets. (Both data sets were inspected, since it is possible for angle information to not be passed properly to the K-band data system.)
Overall, the ability of the S-Pol antenna to follow programmed scans is excellent, with the antenna following within about a tenth of a degree of the desired angles. Any antenna over-shoot is usually very small. The scan plots referenced at the end of this page support that conclusion.
There are a few odd glitches that do occur. We have noted:
The Matlab routine could be run in near real-time, after the completion of any volume scan. Five plots are required to fully evaluate scanning accuracy and allow clear identification of potential problems:
Note that, since S-Pol uses indexed beams, a more appropriate axis for many of the plots might be "delta time", or "time", instead of beam number. This issue will be examined for future applications.
The antenna performance code is GUI-driven, with the
main subroutine plot_pointing_info
available here.
Subroutines may be found
in this directory.
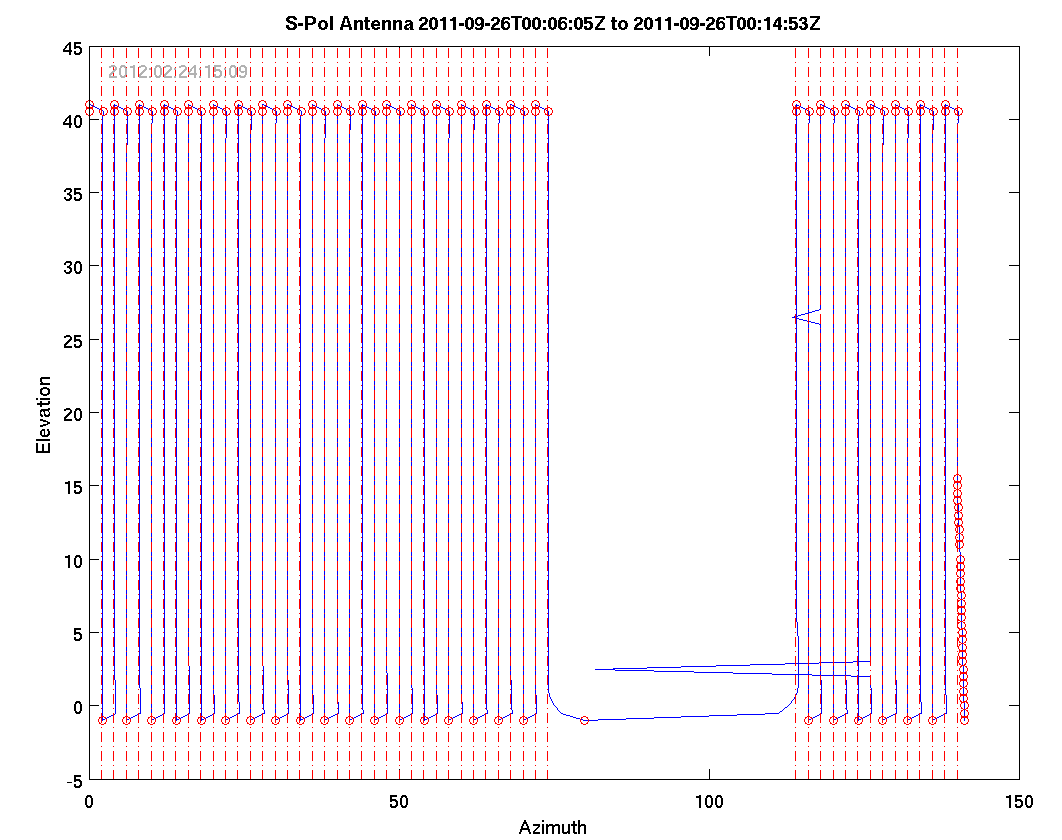
Azimuth vs Elevation for an RHI volume scan. Note the two glitches in the azimuth angle.
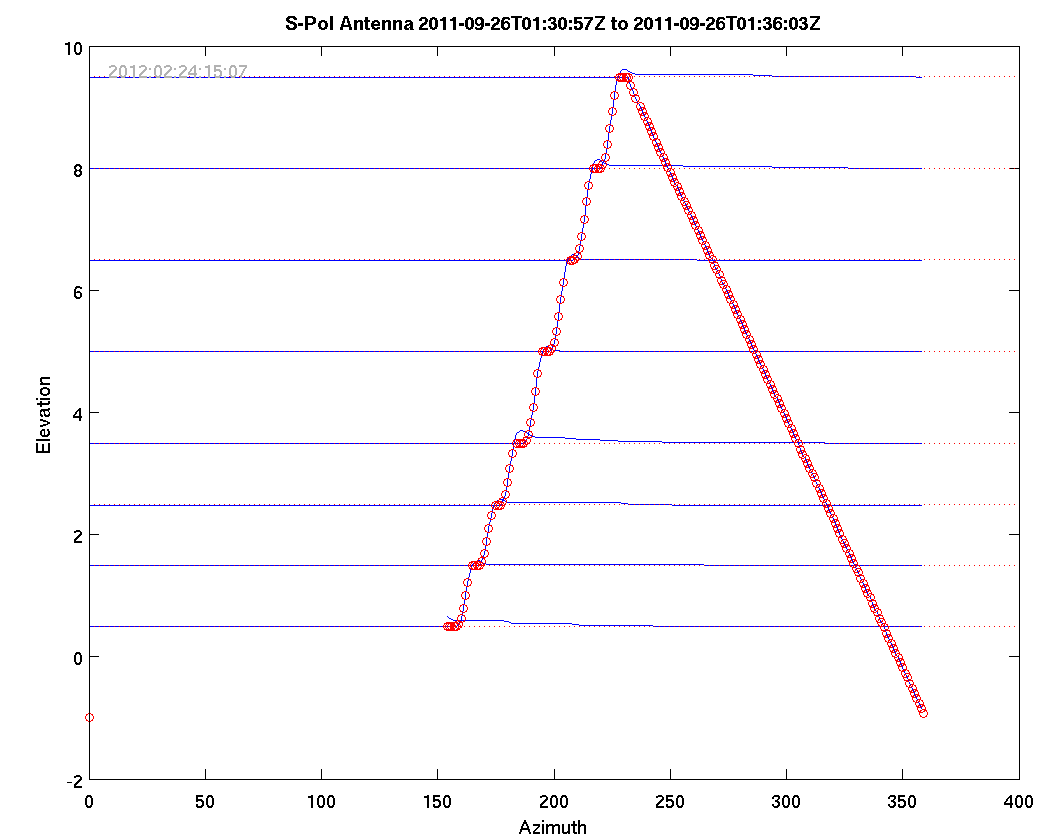
Azimuth vs Elevation for a SUR volume scan.
A more extensive set of scan plots may be found here. These plots were generated after the field campaign, but illustrate the general issues that were seen in the field.
Note: there is an undertermined problem in viewing the comments associated with the sample plots that are referenced by the preceeding link. Under older versions of InternetExplorer, the textual comments (frame 6) do not update when the plots update.
