MJ Mahoney/JPL and Julie Haggerty/NCAR
Last Revision: December 04, 2007
The NSF/NCAR GV (NGV) Microwave Temperature Profiler (MTP) did not participate in the T-Rex field campaign. However, the MTP data analysis software was used to assess the accuracy of the T-Rex in situ avionics (Tavi) and research (Tres) temperature measurements. This web page was created to summarize the results of our comparisons with radiosondes launched near the NGV flight track. This included both normal WMO radiosondes and radiosondes launched by Leeds University in support of T-Rex. We find that both Tres and Tavi have substantial warm biases with respect to raodiosondes launched near the NGV flight track. While Tres has the largest warm bias, we also find that the Tavi warm bias is very significantly pressure altitude dependent.
Introduction
Because radiosondes provide well-characterized temperature profiles of the Earth's atmosphere and because research flights often pass near radiosonde (RAOB) launch sites, JPL Microwave Temperature Profiler (MTP) measurements at flight level are generally calibrated against them; they are also used to evaluate the MTP performance away from flight level. Because there are known biases during T-Rex between the NSF/NCAR GV (NGV) avionics outside air temperature (Tavi) and the completely independent research temperature (Tres) measurement, we were asked if the MTP data calibration/analysis software could be used to evaluate the accuracy of Tavi and Tres. As shown in Figure 1, the NGV flew near several WMO/NWS radiosonde launch sites on its transit flight from Jeffco airport and the study region near Independence, CA.
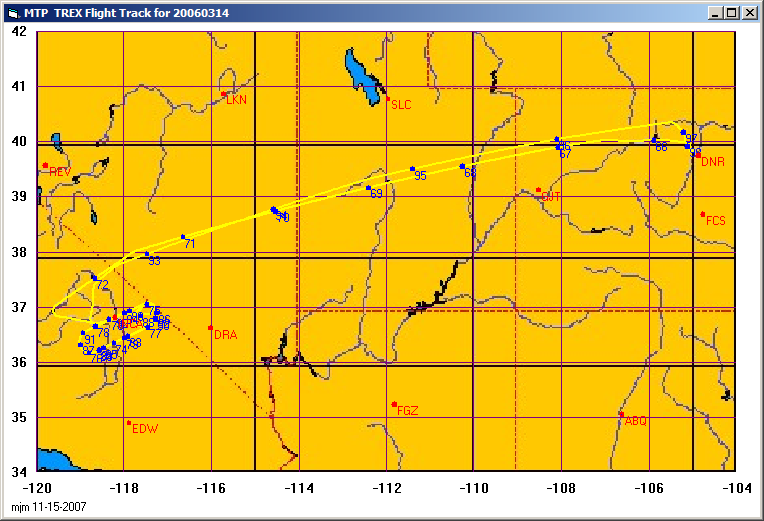
Figure 1. The NGV flight track for the T-Rex flight on 20060314. Two flights took a more southerly transit track.
These included radiosonde launch sites at Denver, CO (DNR), Grand Junction, CO (GJT), Salt Lake City, UT (SLC), Flagstaff, AZ (FZG), Albuquerque, NM (ABQ), Desert Rock, NV (DRA), Reno, NV (REV), and Elko, NV (LKN) and Edwards AFB, CA (EDW). In addition, the Leeds University launched radiosondes from Independence, CA (INCA), which we obtained from the project data archive. Both sets of radiosondes have an accuracy of 0.3 K.
Steps In the RAOB Comparisons
Sampling INCA Soundings
Because the INCA soundings had as many as 3000 levels, we used an existing MTP program (RAOBconvert) to reduce the number of levels to <153 while maintaining good fidelity to the original fully sampled profile. The INCA soundings have the advantage that the NGV spent much of its flight time close to Independence, CA ( INCA in Figure 1), so it would be expected that this would provide the nearest (and therefore best) comparisons for calibration.
Determine Times of NGV Closest Approach to RAOB Launch Sites
Before comparisons between aircraft temperature measurements and RAOBs can be made, we need to determine the times of closest approach of the NGV to the RAOB launch sites. The MTP software includes a tool for doing this, but before this could be done ASCII text files had to be generated from the netCDF archive files. This was done for us by Dick Friesen; these files are based on the raw aircraft data -- no temperature corrections have been applied to the data. Data in these files was provided every 10 seconds of flight time.
UTC ATRL AT_A GGALT GGLAT GGLON PALT PITCH PSFC ROLL TAS_A Time
18:10:04 5.22977 3.27061 1732.84 39.9154 -105.128 1676.13 -0.799787 827.372 -0.675202 0 6147
An example of the first line from the 20060314 flight is shown above. Most of the parameters shown in the header line have obvious meanings. ATRL=Tres is the research temperature and AT_A=Tavi is the avionics temperature. Note that the true air speed (TAS_A) is 0 because the NGV is on the ground. The MTP software would read these files and look for times of closest approach to any of the RAOB sites mentioned above by using a great circle calculation every 10 seconds. Every time a closest approach was seen relevant information (date, time, distance, site name, etc.) would be written to a file. When this was done for all the flights, 648 closest approaches were logged. This is an order of magnitude greater than what we normally find; this is a result of the many orbits flown near Independence, CA.
Calibrate Tavi and Tres Against All The Closest Approaches
As a first pass we used MTP RAOB comparison software especially adopted for the NGV to process all 648 closest approaches. Before discussing these results, we must point out that doing these comparisons well requires a great deal of care to ensure that there is not excessive aircraft pitch or roll at the time of the comparisons (or any temporal variation in them). For the T-Rex comparisons we averaged three samples (30 seconds of data). During this time we required that the aircraft altitude changed by <50 m to minimize the effects of a non-zero lapse rate. The result of these requirements to reduce the number of comparisons from 648 to 498.
We do not make comparisons with a single RAOB as both temporal and spatial RAOB interpolation must be done. Historically the MTP software handled both of these, but the spatial interpolations require a lot of extra work. In recent years we have done only temporal interpolations, but with care to assess the atmospheric variability. That is, we not only examine the RAOBs launched immediately before and after the time of closest approach of an aircraft to a RAOB launch site to see how much the temperature has changed at flight level. We also examine those launch two before and two after for variability.
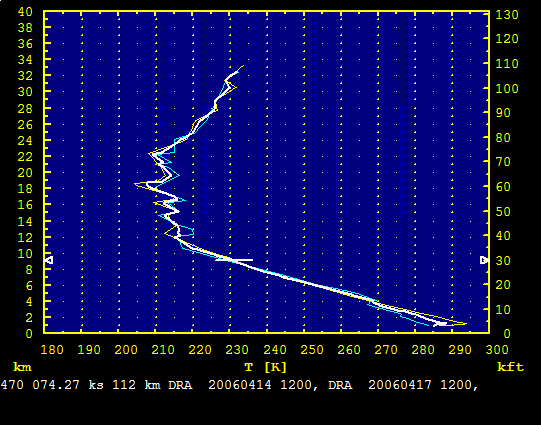
Figure 2. A comparison of Tavi with two interpolated Desert Rock, CA, radiosondes.
Figure 2 shows a comparison of the NGV Tavi temperature (center of horizontal white line at 9 km altitude) with two Desert Rock, CA, (DRA) radiosondes launch on 20060414 at 1200UT (yellow trace) and 20060417 at 1200UT. The comparison is done using the interpolated radiosonde (white trace) corresponding to the time of closest approach (74.27 ks on April 15, 2006. The NGV was 112 km from DRA at the time of the comparison. Even though the RAOBs used cover a span of three days, generally the comparisons are done within hours of the radiosonde launch. This particular comparison was kept because the comparison was made in the troposphere which shows very little temporal variability. Had the NGV been in the stratosphere, the comparison would have be rejected due to the apparent gravity wave activity. With these and other precautions, we found using all the 648 closest approaches that:
Tavi - Traob = 1.34 +/- 0.12
Tres - Traob = 2.18 +/- 0.12
Tavi - Tres =-0.85 +/- 0.02
where Traob is the interpolated RAOB temperature at flight level at the time of the comparison. We see clearly that compared to radiosondes Tres has a statistically significant warm bias of 2.18 K, while Tavi has a warm bias of 1.34 K. This would have been the end of the story, but generally some editting is done during the comparisons if there are objective reasons for doing so. One particular concern is that any one RAOB site might have several entries in the closest appraoch list because the aircraft was doing a lot of manuevering. This was certainly the case near INCA.
In addition, when the first 498 RAOB comparisons were made, there were occasions during level flight when differences in excess of 10 K were observed. When the archived netCDF files were examined, it was clear that the large differences occurred because gravity waves (GWs) were present. The wavelength of the GWs was about 12 km, based on a period of one minute and an aircraft speed of 200 m/s. Including such data could degrade the quality of the comparisons, so this had to be taken into account. While GWs were not expected near the NWS launch sites, they were generally much farther from the NGV, which can also compromise the quality of the comparsions.
The need for closer examination was driven home when comparisons were done for individual flight days. When we evaluated several metrics such as bias, rms and coefficient of variation (COV) with range and temperature threshold, we found there was very significant day-to-day variation. One culprit was obviously the stratospheric gravity wave activity near INCA and possibly other RAOB launch sites.
Remove All Comparisons with Stratospheric Variability
The next step was to remove all soundings showing any temporal variability, which tended to limit the INCA comparisons to the troposphere only. This resulted in 151 comparisons (down from 498). The overall results for 151 comparisons was:
Tavi - Traob = 1.21 +/- 0.12
Tres - Traob = 2.37 +/- 0.12
Tavi - Tres =-1.17 +/- 0.02
which was not that significantly different from our original 498 comparisons. This did improve the comparison metrics from day to day, but there were still day-to-day bias differences begging for explanation.
We were concerned that this might be a result of overweighted use of the INCA soundings, combined with the impact of NWS soundings generally being at much greater range. To evaluate this we used only INCA soundings. One day (20060415) showed some negative biases, which we did not expect. We had included some stratospheric comparisons on this day because the before and after soundings were very similar, but there was some variability. So we removed all the stratospheric sounding and received a big surprise. We had not understood how the Tavi-Tres bias could be so well behaved with range and yet there could be strong day-to-day variability. Using only tropospheric comparisons on 20060415, we found that the bias between Tavi and Tres doubled from about 1 K to 2 K. Clearly there was a pressure altitude dependence for Tavi-Tres. However since the bias of Tres-Traob hadn't changed, the only conclusion could be that Tavi was pressure altitude dependent.
The Bottom Line
Given this smoking gun, we went back to the second cut of 151 comparisons using all the RAOB sites, and studied the biases in two altitude regimes: one using comparisons with pressure altitude from 7.5 to 9.5 km, and one from 11.5 to 13.5 km. The results are shown in Figure 3, where the first range is designated 8.5 km (the average layer height) and the other 12.5 km.
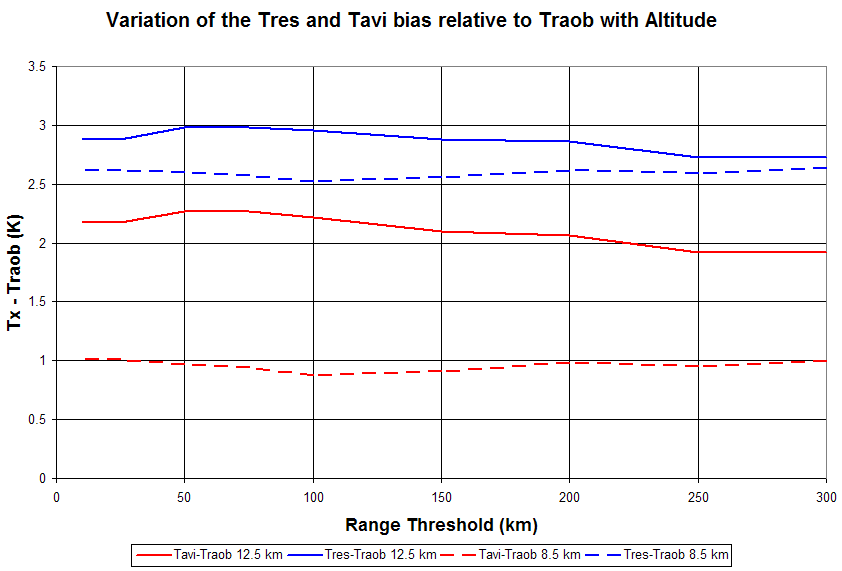
Figure 3. RAOB comparison for two altitude layers with a mean difference of 4 km.
In Figure 3 the solid lines are the 12.5 km comparisons between Tavi-Traob (red) and Tres-Traob (blue), and the dashed lines are the corresponding 8.5 km comparisons. The Tres-Traob (blue) comparisons at 12.5 and 8.5 km are not statistically significant, because if the error bars at each altitude were shown they would overlap. However, the Tavi - Traob comparisons are statistically significant. The bias goes from ~1 K at 8.5 km to more than 2 K at 12.5 km. Tavi has a problem. While not as problematic as Tavi, Tres is 2.5 - 3.0 K too warm.


