Steps In MTP Post-Campaign Data Analysis
MJ Mahoney
10. Select Radiosondes to Calculate Retrieval Coefficients
This is probably the most labor intensive part of the MTP data analysis
for several reasons. For example, there are often circumstances that,
when the radiosonde archive is searched for soundings that are within
some bias and standard deviation of a template
profile identified in the previous step, very few can be found.
Another problem is that while there might be soundings, they burst at
too low an altitude. This is often a problem when selecting sondes for
high altitude aircraft
such as the ER-2, WB-57 and Geophysica, because often soundings burst
near their cruise altitude in very cold conditions. To get around these
limitations, we have to synthesize soundings with appropriate
statistical properties. Tools for doing this are provided in the RAOBman program. There are three
steps to selecting radiosondes to calculate an RC set:
- open a file containing appropriate archival radiosondes,
- specify appropriate filters for the selection process,
- specify the sounding extension parameters,
- specify the altitude range and step size for performing
comparisons with the template profile,
- perform the selection.

Figure 1. RAOBman Select tab
The RAOBman Select tab shown in Figure 1 is where most of the action
happens in RAOBman. A RAOB
file is opened using the Open RAOB
button, which toggles to Close RAOB
when the file is opened. Soundings for a comparison are selected using
the Search button on Select
tab. Before doing so, however, it is often prudent to set some
selection filters, especially when dealing with very large database
of soundings.
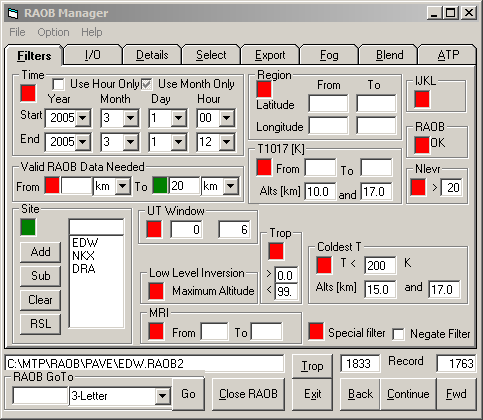
Figure 2. RAOBman Filters tab.
Filtering is done on the RAOBman
Filters tab (shown in Figure 2)
by entering information and clicking un-named check boxes on (green) or
off (red). In the example above, only soundings from Edwards AFB (EDW),
Miramar Naval Air Station (NKX), and Desert Rock (DRA) (see Site frame) would be selected from
the open RAOB file, and only if they reached an altitude greater than
20 km (see Valid RAOB Data Needed
frame, which specifies the range over which a sounding must have valid
data).
Figure 3. An example of how a
synthetic sounding.
Figure 3 which provides an example of
a sounding from Miramar Naval Air Station in San Diego (NKX) being
extended to higher altitudes. The left panel shows that the
NKX2005010200 sounding burst at 23 km (yellow trace). The Miramar
sounding 12 hours earlier (NKX2005010112) managed to get to 31 km
(light blue trace).
Since the two soundings are only 12 hours
apart, and are very similar before the former sonde burst, it is safe
to
bet that the early bursting sonde is similar to the other at higher
altitudes.
Several steps are needed to extend sondes. The first is to describe how
to extend it. This is done by using the triplet of numbers
described in an earlier step: the lapse rate from the burst altitude
to a break altitude
(where the lapse rate changes), and the lapse rate from the break
altitude to 50 km. How this is done is described in the next step.

Figure 4. RAOBman Details tab.
This information is entered in the RAOB
Extension frame of the RAOBman
Details tab shown in Figure 4. LR1 is the lapse rate to
the break altitude Zb, and LR2 is the lapse rate above the break
altitude. It is also possible to add noise to the exended profile. In
the Figure 4, 0.2 K/km of
noise is added to LR1 and LR2, and 0.2 km of noise is added to Zb. Also
seen in the RAOB Extension
frame is the On checkbox.
This must be checked for radiosondes to be extended while being
compared to a template profile. Before soundings can be selected, one
more step is necessary.

Figure 5. RAOBman Export tab.
The Write Average Options
frame of the RAOBman Export tab shown in Figure 5 has several uses. For
comparing and selecting radiosondes, it specifies the minimum and
maximum altitudes over which soundings are compared, as well as the
altitude step size. In this example, soundings are compared from 0.5 to
50 km in 0.5 km steps. Although the highest altitude is 50 km,
statistics are only collected up to the burst altitude of the template
profile.

Figure 6. The RAOBman Select tab
We are now in a position to select soundings that match a particular
template profile. This is illustrated in Figure 6. As shown in the list box,
the Desert Rock (DRA) sounding for 20020115 at 0000UT was selected (and
automatically hi-lited). The Save
Ref button was clicked to use the DRA sounding as the template
profile. When the Save Ref button
is depressed, the following box will appear if the template profile is
not in the MISSION_RAOBrange.txt file:

This illustrates one of the uses of the MISSION_RAOBrange.txt file. If
the sounding was present in this file, then RAOBman would automatically enter
the LR1, Zp and LR2 information into the RAOBman Details tab RAOB Extension frame. When dealing
with many dozens of template profiles, this is a real convenience
because after doing a few manually, there is a tendency to forget to
change these values, and then everything has to be redone.
That done, the AVG and RMS text boxes were filled in with
2.0 and 3.0 K, respectively, to specify how close potential RC
soundings had to be to the template profile to qualify for inclusion.
In addition,
the Use Bias check box was
checked to enable the 2.0 K bias requirement. If it was not check, the
bias would not only be ignored, it
would in fact be removed. This
feature is present so that when it is difficult to find enough
comparable soundings, any sounding that has the "right" shape will be
used, even if it has a very large bias. Finally, the RMS button is depressed to search
for soundings that meet the selection criteria. In this case, 244 were
found, which is a reasonable number to calculate an RC set. (100 is the
absolute minimum.) The results of the radiosonde selection process are
shown in Figure 7. RAOBman
automatically saves the selected soundings in a file with the following
fixed format:
XXXXX_YYYYMMDDHH.RAOB2
for example:
DRA___2002011500.RAOB2
in this case. Five placeholders are provided for the
sounding name XXXXX to accomodate WMO Numbers when ICAO names are not
available. These files are saved in the C:\MTP\RAOB\MISSION\ folder, where RCcalc will go to look for them when
RCs are to be calculated.
Figure 7. The template profile
(yellow) is shown in the left panel, and the selected soundings
(yellow) are shown in the right panel . The average of all the selected
soundings is show in white in both panels.
Sometimes when using very large archival data bases, you might end up
with 500 or more soundings that meet your selection criteria. These can
be reduced by reducing the AVG
and RMS selection criteria,
and then repeating the selection process by depressing the RMS button. (The program will
remember the Save Ref
template profile.) You will get a warning box:
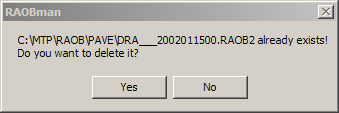
to indicate that the file containing the previously selected soundings
is about to be deleted. Normally, you would click to Yes button to continue. This is a
precaution because it has been beneficial in the past!
The best strategy for selecting template profiles is to use radiosondes
in the MISSION_RAOBrangeAll.RAOB2 file with an emphasis on those
soundings that are closest to the aircraft flight tracks during a
campaign.
Previous
| Next | Index |


