XPMS2D User's Guide
Version 3.0.3
Table Of Contents
- Overview
- Getting Started
- Acquiring
- Installing
- Environment
- Fonts
- Command line options
- Probe Selection Window
- Entering start time
- Selecting and Deselecting Probes
- Paging through data
- Plot Canvas
- Guide to menus
- File menu
- View Menu
- Options Menu
- Known problems
Overview
xpms2d is an interactive diagnostic and plotting tool for Unix/Linux workstations. xpms2d allows the user to view PMS-2D, 64 bit Fast2DC, 2DS, HVPS1, and CIP/PIP images and computed quantitative information on a per record basis.
The primary file format supported is here https:://www.eol.ucar.edu/raf/software/OAPfiles.html. We use translators (pads2oap and translate2ds) to convert SPEC and DMT probe data to this format. These translators are available as part of the github repository listed below.
xpms2d was written at the Research
Aviation Facility of The National Center for Atmospheric Research to view and perform quality control of our PMS-2D data.
Every effort has been made to make it "what you see is what you get" between
the screen and printouts.
Getting Started
Acquiring
- xpms2d is available at https://github.com/ncar/aircraft_oap. Check out with 'git clone --recursive https://github.com/ncar/aircraft_oap'.
Installing
- For system use, the binary may be placed in something like
/usr/local/bin.
For single user, place the binary in ~/bin (Make sure ~/bin is in your
PATH).
Environment
- xpms2d is written in C++, requiring X11/R6 and Motif 2.0 (or later).
Specifically it was developed on Redhat Enterprise Linux, using
the GNU compiler gcc. xpms2d has
been successfully compiled on Mac OS X, this does require, XCode and XQuartz. See
Makefile for more details.
xpms2d uses, though it is not required, a shell environment variable
called DATA_DIR as the default directory to locate data files.
Command Line Options
- data_file, a raw PMS-2D data file.
Examples
- Run with no command line parameters:
1024% xpms2d
- Load a single data file:
1025% xpms2d /home/data/162rf08.2d
Probe Selection Window
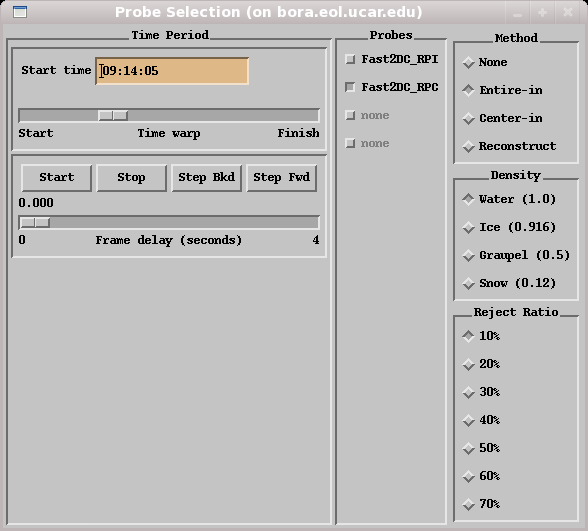
Figure 1. xpms2d Control Window.
Moving around the file
Entering start time
Enter the start time in the left text widget and press apply to advance to a
specific time. The Time warp scale may be dragged to correspond to
a certain point in the file.
Movie/Advancing
The Start and Stop buttons may be used to automatically advance
frames of data, use the Frame delay scale for the desired amount of
delay between page updates. Step Bkd and Step Fwd buttons
may be used to advance forward and backwards when the movie is stopped.
Selecting and Deselecting Probes
Click button(s) for probes you wish to view.
Sync and timing word legend:
- Green = accepted
- Yellow = zero area image/rejected
- Red = rejected
- Blue = Overload word, Fast2D only.
- Black = not detected by software
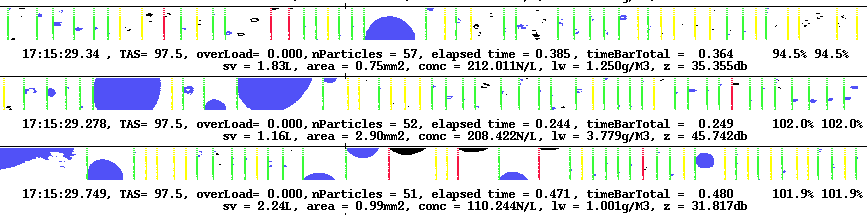
Figure 2. Sample data from xpms2d of traditional 32 diode 2d data.
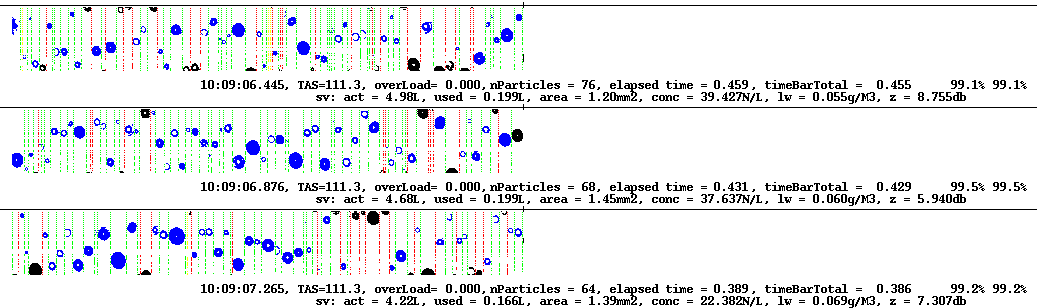
Figure 3. Sample data from xpms2d of new 64 diode Fast2D data.
First line of text
- Time stamp is stamped at the moment the data sytem is interrupted to
download the data (End of Record).
- TAS = True Air Speed.
- overLoad = The length of time the probe was
shut down while downloading this record (shouldn't exceed 86 millseconds
[red] for RAF data) in milliseconds.
- nParticles = The number if particles detected
by the software in the record.
- elapsed time = The difference between this
time stamp and the previous one. This delta data system time, in seconds.
- timeBarTotal = The summation of all the timing
words in the record, in seconds.
- 1st % = % over- or underlap of timing words compared to data system time stamps (timeBarTotal / elapsed time).
- 2nd % = % over- or underlap of timing words plus the overLoad compared to data system time stamps (timeBarTotal+overLoad / elapsed time). 100.0% is a perfect value.
Second line of text
- sv = Sample Volume (see Figure 3).
- area = Sum of all shadowed pixels.
- conc = Total concentration as determined by selected method.
- lw = Liquid water content.
- z = Reflectivity.
Method
- Basic
- Actual sample volume which passed through the probe, with no additional rejection
other than listed below. Particle size is the greater of ix and iy.
ix is along the flight path.
- Entire-in
- This emulates the 260X. Any particle which touches an end diode is rejected.
Particle height (iy) is used for sizing.
- Center-in
- Any particle who's center is within the diode array is kept, with the size being the
greater of ix and iy. This is used in our size distribution algorithm and
a good all around choice.
- Reconstruction
- Particles where iy is at least 20% of ix are kept.
Basic rejection criteria for all methods above:
- Zero-area-images are rejected.
- Stuck bit rejection, where iy equals 1 and ix is greater than 3.
ix is along the flight path.
- Area ratio rejection is applied. That is total number of shadowed pixels divided
by computed area based on diameter (max x, y).
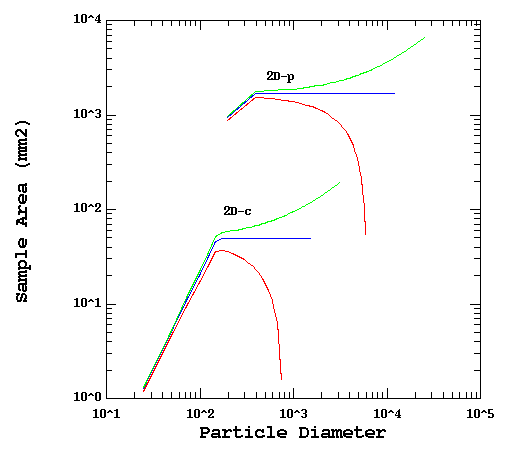
Green = Reconstruction,
Blue = Center-in,
Red = Entire-in
Figure 3. 2D sample volumes for 32 diode probes.
Algorithms are outlined in:
Heymsfield, A. J., Parrish, J. L., 1978: A Computational Technique for Increasing the Effective Sampling Volume of the PMS Two-Dimensional Particle Size Spectrometer. J. Appl. Meteor., 17, 1566-1572
Density
Different densities may be selected based on what you believe the aircraft was
flying through. This affects the Liquid Water Content calculation.
Reject Ratio
This is the area ratio rejection percentage. Use 10% to 20% for general mixed
phase data and 50% for rain. This is the number of shaded diodes in the
bounding box divided by the area of the bounding box. Bounding box is particle
height and length.
Canvas Features
Magnify
By "drawing" a box with the left mouse button on the canvas, a new window will pop up
with contents of the box magnified by a factor of two.
Guide to Menus
File Menu
- The items in the File menu allow opening of data files from disk,
printer setup, and printing. In the case of an operation that will
overwrite an existing file, you will be prompted by an alert that allows
you to abort the write if you don't want the file to be overwritten.
Open Data File
- This displays a File Selection Box to select a file to read. There
is no error checking to see if the input file is valid. Invalid files
tend to cause a segmentation fault. If this is the first time you have opened
this file, xpms2d will create an index file; this may take a minute or
more.
Save PostScript
- This displays a File Selection Box prompting for the name of the file
where you want to write the PostScript output.
Printer Setup
- This pops up a window with options to change the 'lp' command, the size of
plot to be printed, whether to print landscape or portrait, and color vs.
black and white.
Print
- This opens a pipe and sends PostScript commands to lp(1).
- This option allows you to save the plot image as a graphics file, which
can then be used in web pages, etc. You can adjust the size of the image
saved by first sizing the plot canvas.
View Menu
View Hex
- Pops up a seperate window with an ASCII hex dump of each PMS2D record.
View Histograms
- Pops up a seperate window with ASCII bin count histogram data per 2D record.
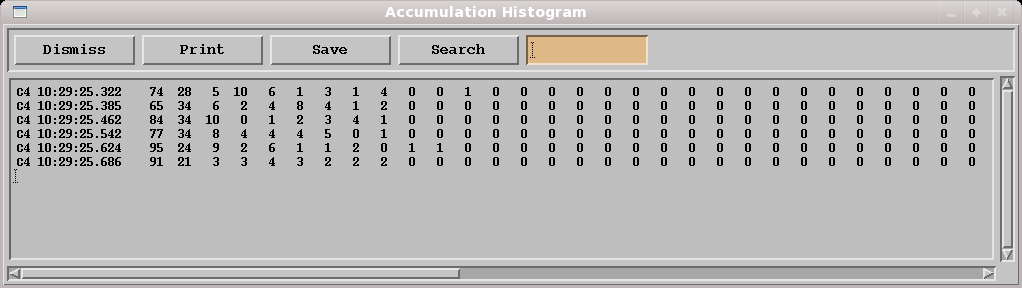
Figure 5. Histogram for each record. There are 64 columns for resolution(i) from 1 to 64.
View Particle Data
- Pops up a seperate window with particle by particle blow of the records being displayed. Information includes particle height, width, area, time word, and whether the particle was rejected or accepted. Printing, Saving, and Searching are available options.
Normal
- This is the default ASCII output displayed below each record. A histogram of bin sizing will be displayed on the right.
Diagnostic
- Changes the ASCII output below each record to display information about timing words and probe frequency. Diode count histogram will be displayed on the right. this is the number of times each diode was shadowed, not inluding sync and timing words.
Raw Data Records
- This will display the raw 2d record with no processing. Just loop through all slices and draw them. It will then display the processed record below the raw record. Useful for debugging xpms2d.
Options Menu
Toggle Timing Words
- Toggles on/off display of timing words.
Toggle Histograms
- Toggles on/off display of histgrams at the end of image data.
Wrap Display
- The HVPS has more than a 1024 "slices" per buffer. By default xpms2d will just run the display off the edge. By toggling this option, records will "wrap" on the display so all particles are visible.
Toggle Synthetic Data
- This will have xpms2d toggle to a uniform record of data for double checking calculation accuracy.
Known Problems
- Using the window manager X to close or dismiss a window will cause a core dump. Use 'Dimiss' buttons.
- If the menu and button text shows up as squares, then some fonts are missing.
'yum install "xorg-x11-fonts-ISO8859-1*"' should solve the problem.
- Invalid data files may cause a core dump.
Author
Christopher J. Webster
National Center for Atmospheric Research
Research Aviation Facility.
email Chris Webster
Last update:
Fri Nov 17 14:52:24 MST 2023