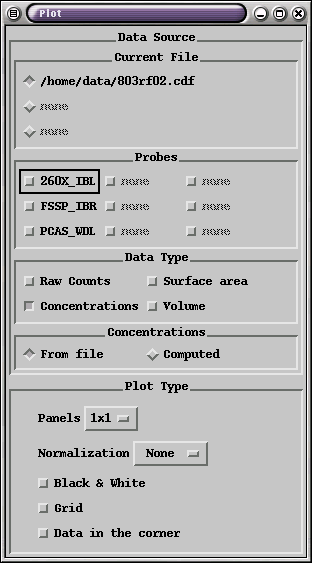
Selecting and Deselecting Probes
- After you have selected which data file, turn on the probes you wish to
view. Multiple probes may selected.
To de-select a variable, click on it again. The file, axis, location and panel must all match from when the variable was selected. This can get confusing if you are drawing data from multiple files.
Data Types
- Turn on which data types you wish to view (you may select more than one). Turning off all data types will cause a core dump at this time.
Concentrations
- You may choose to have ncpp read concentrations from the netCDF file (the default), or compute them on the fly. Computing is useful if you want to modify certain probe parameters (see Edit Cell Diameters).
Options
- Panels
- This allows you to select how many Postage stamps to display per data type.
- Normalization
- This allows you to select a normalization method for dividing down concentrations. Options are None, Linear, and Log.
- Black & White (on/off)
- Converts all color traces to black and white. Dashed lines are used to differentiate variables in black and white. This option is provided to let the user preview black-and-white print-outs.
- Grid (on/off)
- Turns grid on or off.