Julie Haggerty/NCAR
MJ Mahoney/JPL
Last Revision: September 27, 2013
Introduction
We summarize on this web page, the results of the analysis of the Microwave Temperature Profiler (MTP) data obtained on the NSF/NCAR GV (NGV) during the MPEX field campaign. Its purpose is two-fold: to present the final MTP data with comments on data quality for each flight, and to describe the use of in situ temperature measurements for MTP gain calculations.The header record in our production data files ('MP-files') provides a link to this website where users can obtain a summary of data quality and interesting features associated with each flight. Following this summary, we provide information on how the aircraft in situ temperature was verified against radiosonde data prior to its use for MTP calibration.
Comments on the MPEX MTP Final Data
The following table provides a link to a color-coded temperature curtain (CTC) for each of the MPEX research flights. More importantly, the table also provides a comments field which includes summaries of each flight. Clicking on each thumbnail image will show the full-sized CTC image in a popup window, so that the image can be viewed while reading the comments. These comments may indicate areas of reduced data quality and/or significant features noted in the temperature profiles.
On each of the following CTC plots the x-axis is the Universal Time (UT) in kilo-seconds (ks), the left y-axis is the pressure altitude in kilometers (km), and the right y-axis is the pressure altitude in thousands of feet (kft). On the right is the color-coded temperature scale, which ranges from 170- 320 K. Also shown on each plot is the GV's altitude (black trace), the tropopause altitude (white trace), and a quality metric (gray trace at the bottom). The quality metric, which we call the MRI, ranges from 0 to 2* on the left pressure altitude scale. If the MRI is <1, we consider the retrieval to be reliable; if it is >1 the retrieval is less reliable, and users should contact us as to whether it can be used or not. The MTP productionl data have been edited to include retrievals with the MRI<0.8. If this excludes a specific time period of interest, users may contact us to see whether we can salvage data that is not shown here.
The CTC plots are generally restricted to +-8 km from flight level.
* The vertical coordinate on the CTC plots for MPEX begins at 3km, rather than 0 km. For that reason, the MRI trace ranges from 3 to 5, rather than the standard 0 to 2 as explained above. MRI values associated with each profile in the data files are within the usual 0 to 2 range.
| CTC | Comments |
|
RF01 -- 20130515 |
Research flight from BJC to New Mexico, Texas and return Good retrievals were obtained throughout this flight as indicated by small MRI values. Double tropopauses occur periodically over the duration of the flight. |
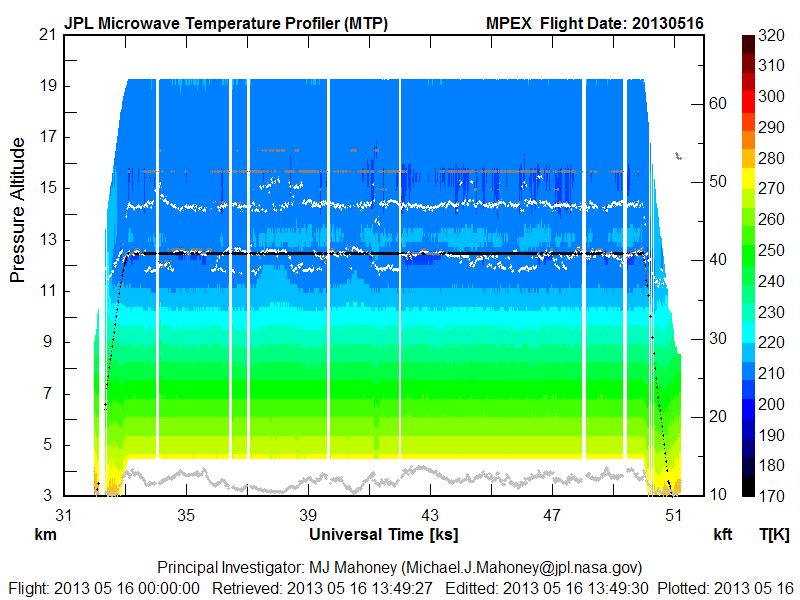 RF02 -- 20130516
|
Research flight from BJC over mountains of Colorado and New Mexico MTP performed well throughout the flight. Retrieval coefficients were adequate, but MRI values are soradically higher during this flight (generally less than 1 though). Double tropopauses were again observed. |
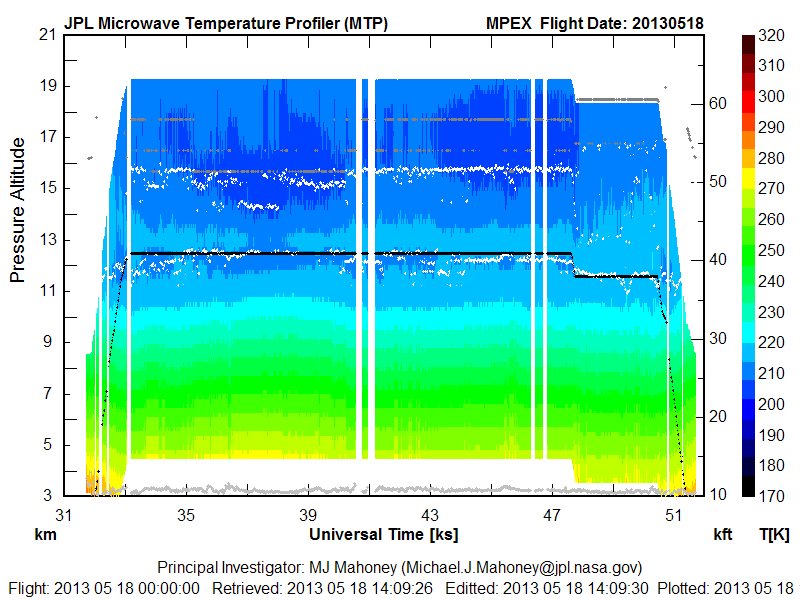 RF03 -- 20130518
|
Research flight from BJC to SE Colorado This flight ended early due to a malfunction with the dropsonde system. MTP performed well for the duration of the shortened flight, and good retrievals with low MRI values were obtained. |
|
RF04 -- 20130519 |
Research flight from BJ to SW Kansas, Texas panhandle, and New Mexico The data for this flight looks excellent. Significant mesoscale variability was observed near flight level, particularly between 43 and 47 ksec. |
|
RF05 -- 20130521 |
Research flight from BJC to western Texas and New Mexico MTP data from this flight are very good. |
|
RF06 -- 20130523 |
Research flight from BJC to New Mexico and Texas panhandle The retrieval for this flight look very good. There is some uncertainty in the height of the upper tropopause at 33-35 ksec and 46-49 ksec. |
|
RF07 -- 20130527 |
Research flight from BJC covering areas of Kansas, Nebraska, Colorado, Utah, and New Mexico The data for this flight look excellent. Double tropopauses persist throughtout, with some uncertainty in the upper tropopause height early int he flight. |
|
RF08 -- 20130528 |
Research flight from BJC to sourthern Colorado and New Mexico A small amount of data were lost during the initial ascent due to operator error. The rest of the flight looks good. |
|
RF09 -- 20130530 |
Research flight from BJC over mountains of Colorado and New Mexico Significant variability in the temperature field at the tropopause level and above, especially during flight over mountains.Retrievals are generally good, with some periods of slightly elevated MRI values. |
|
RF10 -- 20130531 |
Research flight from BJC over Colorado, New Mexico, and western Texas The retrievals for this flight look very good. |
|
RF11 -- 20130603 |
Research flight from BJC over Colorado and Wyoming The MTP performed well on this flight. Mesoscale variability associated with a cold front over Wyoming and Colorado degrade retrieval quality somewhat beginning around 42 ksec. |
|
RF12 -- 20130608 |
Research flight from BJC to Wyoming and NE Colorado The retrievals for this flight generally look good. Temeprature variability associated with the upper-tropospheric trough/jet is evident. |
|
RF13 -- 20130611 |
Research flight from BJC to Wyoming and eastern Utah There was a problem with MTP during ascent which was corrected as the plane reached altitude. Data from the remaider of the flight are good. |
|
RF14 -- 20130612 |
Research flight from BJC to South Dakota, Nebraska, Wyoming A small amount of data were lost during the ascent due to a software problem, but MTP worked well for the rest of the flight. |
|
RF15 -- 20130614 |
Research flight from BJC to Wyoming, Colorado, New Mexico The retrievals for this flight look excellent. |


MPEX Temperature Calibration
1) Some Background
For more than two decades the MTP team has been refining techniques for evaluating and correcting in situ temperature measurements made aboard research aircraft by performing comparisons with radiosondes launched near the aircraft's flight track. This measurement is of interest because in situ temperature at flight level is used as a second calibration point (in addition to measurement of a heated target within the MTP canister) to calculate gain for each scan. Procedures have evolved over the years, and the current process was first employed for the T-Rex campaign. It is described in detail on a similar web page for T-Rex. We have continued to refine the temperature calibration techniques that we developed for T-Rex on subsequent GV campaigns. There are other web pages that describe this procedure for START-08, HIPPO 1, HIPPO 2, HIPPO 3, PREDICT, DC3-TEST, HIPPO 4, HIPPO-5, TORERO.
2) MPEX specifics
Numerous routine radiosondes were available near the flight tracks for MPEX, making verification of the in situ temperature measurement straightforward. Over 100 comparisons of flight level in situ temperatures with nearby radiosonde temperatures were available during the project. Three reserach temperature measurements were available in addition to the avionics temperature measurement. The radiosondes provided a reference to determine which of the four temperature sensors provided the most accurate measurement. Comparison of each of the measurements with available radiosonde flight level temperatures demonstrated that the variable ATHR2 (provided by a heated HARCO probe) gave us the most accurate temperature. A slight correction was applied to eliminate variation with Mach number squared before using the in situ temperature measurement to calculate gain. For the temperature calibration we used the procedure that adds a correction to the in situ temperature as a function of Mach Number squared. Using this procedure we found that ATHR2, when forced to agree with the ~100 radiosonde comparisons near the GV flight track, had the following corrected (ATHR2c) value:
ATHR2c = ATHR2 -0.021 * Mach2 +0.0403
With ATHR2c in hand, we could calculate the MTP instrument gains for each observing frequency as:
G = [Counts (Horizon) - Counts (Target)] / [ATHR2c - Ttarget] in Counts/Kelvin.
where Counts (Horizon) and Counts (Target) are just the output of the MTP when looking at the horizon (i.e., an in situ measurement in front of the GV) and the reference target. (The gain calculation is actually not this simple because of emissivity and reflectivity issues, but we'll spare you the details!) With the gains in hand, we could now do retrievals. After the first pass through all the flights, we calculate what we call a Window Correction Table (WCT). These are small temperature corrections that are applied to the measured brightness temperatures to correct for scan mirror side lobes. By design the WCT is always 0.0 K when the scan mirror elevation angle is zero, so this does not affect the flight level temperature calibration. Another retrieval pass is made through all the flights with the WCT applied.
Finally we assess the accuracy of the MTP retrievals at all retrieval altitudes, not just flight level. Any remaining biases are removed using a sixth-order polynomial fit to determine the correction that gives the smallest over-all bias with respect to radiosondes. The result is shown in Figure 2. Note that the final data set contains a very small bias wrt radiosondes at flight level; however, our goal is to provide the best retrieved temperatures at all retrieval levels, not just flight level.
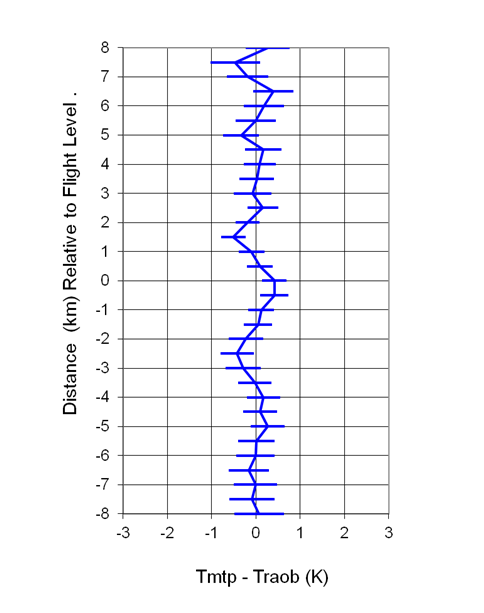
Figure 2: Accuracy of MTP profiles compared to ~100 radiosonde profiles near flight tracks in MPEX.


