
 SHEBA ISFF Flux-PAM
Project Report
SHEBA ISFF Flux-PAM
Project Report
SHEBA ISFF Flux-PAM
Project Report
SHEBA ISFF Flux-PAM
Project Report
Based on the SHEBA data set, Ed Andreas has concluded that the near-surface water vapor over Polar sea ice is always near ice saturation. Observational evidence and a theoretical model supporting this hypothesis are presented in a manuscript submitted for publication in JGR appropriately titled, "Near-Surface Water Vapor Over Polar Sea Ice is Always near Ice Saturation". The authors are Ed Andreas, Peter Guest, Ola Persson, Chris Fairall, Tom Horst, Steve Semmer, and Dick Moritz.
The observational evidence includes RH measurements by the PAM and SPO Vaisala 50Y hygrometers used at the PAM and SPO stations and the Vaisala 235C hygrometers used on the ASFG tower. One troublesome aspect of the data is that the 50Y sensors indicate increasing sub-saturation wrt ice below -20 C, down to 90% RH.ice at -40 C, while the 235C sensors indicate increasing super-saturation below -20 C, up to 106% at -40 C. Below -20 C, the range of RH.ice at any given temperature is quite narrow for any individual sensor, on the order of 2-4% RH.ice, so that none of the sensors recorded a significant occurence of 100% RH.ice below -25 C.
In an attempt to understand the sensor behavior, a number of laboratory tests were run in the NCAR Sensor Calibration Laboratory. The basic tests pumped air at 20 C and 40% RH into a controlled temperature chamber. The supply air was provided by the exhaust stream from the Thunder Scientific humidity calibration chamber, located across the room. As the temperature chamber was cooled, it was assumed that the external air stream, confined to a small diameter tube, would become saturated with respect to ice. Within the temperature chamber, the air was piped to a small cylindrical manifold into which four capacitance RH sensors could be inserted in series. The air was then piped to a slightly larger diameter cylindrical chamber containing the sensing element of a dew point hygrometer, and finally the air was exhausted to the room. The dew point hygrometer has its own ventilator to draw air across its sensing mirror. The electronic control unit of the dew point hygrometer was located external to the temperature chamber.
It took several attempts to obtain satisfactory results in the frost point tests. One major problem was the elimination of leaks that diluted the saturated air piped to the manifold with the drier air within the temperature chamber. The first satisfactory frost point test occurred on 12-15-00.
Supporting tests were made in both a Thunder Scientific humidity calibration chamber and in an oil bath temperature calibration system. The Thunder Scientific chamber was used to check the calibration of the capacitance and dew point hygrometers up to about 90% RH.ice and at temperatures down to -15 C and -20 C respectively, the limits of the capability of that chamber. The oil bath was used to test the calibration of the mirror temperature sensor down to -40 C, again the lower limit for that device.
The Vaisala capacitance hygrometers tested were one NCAR 50Y sensor and three ETL 235C sensors. The history of these sensors subsequent to the SHEBA field experiment is unknown and in fact the specific NCAR 50Y sensor may not have been used during SHEBA. The 235C sensors were
The NCAR 50Y was calibrated around June 2000 over a range of 10% RH to 90% RH at temperatures of 20, 26, 32, and 38 C. We find that over a normal range of operation, e.g. -10 C to 30 C, the Intercap humidity transducers are insensitive to temperature. Thus the calibration data are used to fit a second order polynomial in the sensor output voltage to measured RH, with no variation as a function of temperature. During operation, this polynomial is applied to the sensor output by an NCAR microprocessor. The 50Y employs a fiber GoreTex-like filter to protect the transducer from liquid water. These filters were used during SHEBA but was not used for the frost point laboratory tests.
The third hygrometer used during these tests was a Meteolabor TP3-ST miniaturized dew point hygrometer. The sensor assembly is physically separate from the control circuitry. Only the sensor assembly, containing the mirror and a ventilator, was placed in the temperature chamber. The mirror temperature is measured by a thermocouple relative to a metal block in the control unit. The absolute temperature of the mirror is thus the absolute temperature of the block, measured by an independent sensor, plus the temperature of the mirror relative to the metal block.
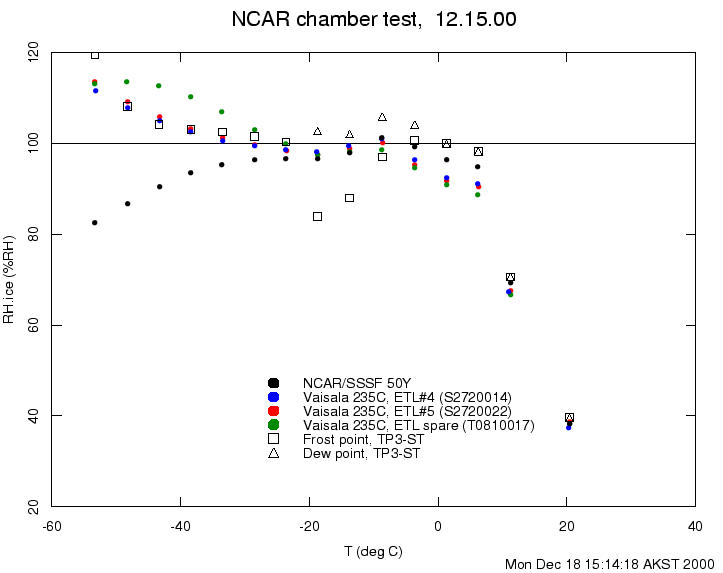
This was our first satisfactory frost point test, with measured RH very close to saturation between 0 C and -30 C. Apparently we were still not achieving saturation in previous runs, but now the data from the capacitance sensors meet our expectations (a hazardous situation!). Below -30 C the divergence between the 235C and 50Y sensors even mimics that seen in the SHEBA field data. The only change from the 12-14-00 run was to replace a copper cooling coil inside the temperature chamber with a much shorter length of larger i.d. plastic tubing. This line carries the moist outside air to the small manifold holding the test sensors in the temperature chamber. We replaced the copper coil because we were concerned about possible freezing of liquid water in the long length of small i.d. copper tubing.
The dew point hygrometer does not output air temperature, so the temperature of the Vaisala sensors which are in the manifold upstream of the dew point hygrometer were used to calculate RH. Note that using the temperature of the Vaisala sensors adds additional uncertainty to the RH values calculated from the dew point hygrometer. The 50Y does not measure temperature below -40 C, so the median of the 235C temperatures was also used to calculate saturation vapor pressures at those temperatures.
The dew point hygrometer RH is in fair agreement with the 235C's. Between 0 and -20 C it appears that supercooled dew may be forming on the mirror rather than frost. Below -25 C, the dew point hygrometer indicates super-saturation.
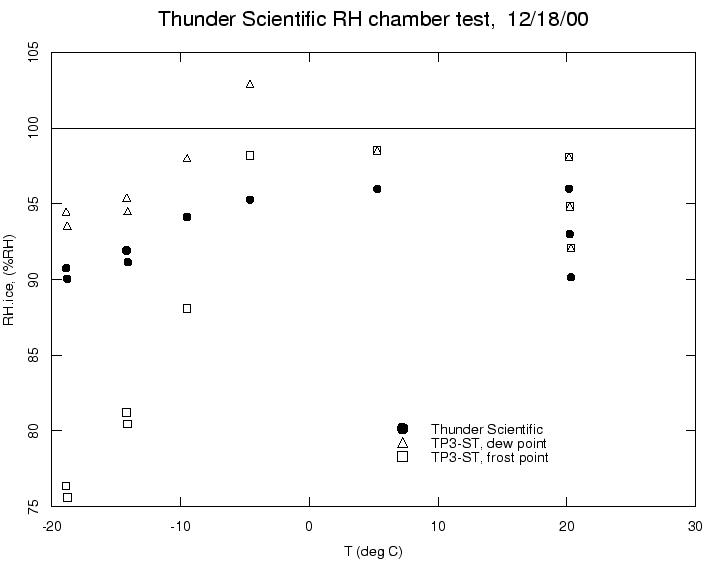
We calibrated the Meteolabor TP3-ST dew point hygrometer in our Thunder Scientific humidity chamber. The Thunder Scientific calibration apparatus saturates air at one temperature and pressure and then pumps the air into the measurement chamber at another temperature and pressure to achieve the desired calibration atmosphere. Thus the calibration depends on measurements of temperature and pressure, not a direct measurement of humidity. The stated accuracy of the chamber is 1% RH.
A plot of the data shows RH.ice as measured by the chamber and by the dew point hygrometer, assuming that the mirror is covered by either dew or frost. I conclude two things from this test. First, this appears to confirm that the dew point hygrometer is measuring a dew point rather than a frost point between 0 C and -20 C. (There is one contradictory data point at -5 C.) Second, the dew point hygrometer reads high by about 2% RH from 0 C to 20 C and by about 3-4% RH between 0 C and -20C. These measurements support the conclusion that the frost point tests of the capacitance RH sensors are quite close to saturation wrt ice down to -20 C.
I'm still unsure about the data below -30 C. I looked briefly at that data and found that the 235C RH readings are still decreasing even after an hour soak at those low temperatures. Our protocol is to run for an hour at each temperature point and then collect the last 5 minutes of data before decreasing the temperature for the next data point.
Following are the time-rates of change of temperature and RH.ice for the 12-15-00 frost point tests. These were calculated as the slope of a linear fit to the time series data for the last 10 minutes of each 1-hour set point of the chamber temperature. The ETL data were collected at 0.2 Hz and the 50Y data were collected at 1 Hz.
The rates of temperature change are generally independent of temperature and sensor, suggesting that these may be real changes in the chamber environment. The rates of RH change are temperature-dependent and vary between sensors, indicating that at least a part of the RH rate-of-change may be caused by slow sensor response.
The magnitude of dRH/dt increases with decreasing temperature below -30 C. Does this imply increasing dis-equilibrium related to a slowed rate of condensation and thus a potential for super-saturation? If so, is a similar mechanism responsible for the field data?
Note that the time constant of capacitance RH sensors increases exponentially with decreasing temperature. For the 50Y we find
tau(T) = tau(20C)*10(293.15 - T(degK))/40
and tau(20C) is about 1 second without a filter covering the transducer. Thus tau(-40C) ~ 30 seconds.
ETL #5
 T(degC)  ndat  dT/dt(degC/s)  dRH/dt(%RH/s)
    20.4   120        0.0e+00       -1.2e-04
    11.1   117       -2.1e-04        1.2e-03
     6.0   118       -1.1e-04        1.2e-03
     1.3   118       -1.1e-04        6.8e-04
    -3.5   116       -7.4e-05        3.6e-04
    -8.3   118       -1.7e-04       -3.5e-04
   -13.6   117       -1.1e-04       -8.7e-04
   -18.3   118       -1.4e-04       -3.2e-05
   -23.2   120       -1.7e-04        7.4e-05
   -27.1   118       -1.6e-04       -5.3e-05
   -32.3   113       -1.8e-04       -2.3e-04
   -37.1   116       -1.7e-04       -4.3e-04
   -41.5   117       -1.6e-04       -7.3e-04
   -47.9   120       -1.6e-04       -8.3e-04
   -53.2   120       -1.4e-04       -8.7e-04

ETL spare
 T(degC)  ndat  dT/dt(degC/s)  dRH/dt(%RH/s)
    20.4   119        2.2e-05       -1.0e-04
    11.2   119       -4.4e-04        2.2e-03
     6.2   120       -2.4e-04        1.8e-03
     1.3   120       -2.1e-04        1.0e-03
    -3.6   120       -1.4e-04        8.8e-04
    -8.7   120       -2.5e-04       -5.8e-04
   -13.7   120       -1.9e-04       -3.8e-04
   -18.5   120       -2.4e-04        2.1e-05
   -23.6   120       -2.3e-04       -1.9e-04
   -28.3   119       -2.4e-04       -3.1e-04
   -33.0   118       -1.7e-04       -5.0e-04
   -38.5   120       -1.8e-04       -8.0e-04
   -42.7   119       -2.5e-04       -1.2e-03
   -48.0   120       -2.2e-04       -2.0e-03
   -52.5   119       -1.9e-04       -1.5e-03

ETL #4
 T(degC)  ndat  dT/dt(degC/s)  dRH/dt(%RH/s)
    20.5   120        3.3e-09       -1.3e-04
    11.3   120       -3.6e-04        1.8e-03
     6.2   120       -1.7e-04        1.6e-03
     1.4   120       -1.7e-04        9.0e-04
    -3.6   120       -1.4e-04        6.7e-04
    -8.6   120       -2.0e-04        1.2e-04
   -13.7   120       -1.8e-04        5.8e-05
   -18.7   120       -1.8e-04        5.2e-04
   -23.6   120       -1.9e-04        2.5e-05
   -28.5   120       -1.7e-04       -3.8e-04
   -33.5   120       -1.8e-04       -7.4e-04
   -38.4   120       -1.8e-04       -9.3e-04
   -43.3   120       -1.6e-04       -8.6e-04
   -47.9   120       -1.7e-04       -9.6e-04
   -53.3   120       -1.4e-04       -9.3e-04

NCAR 50Y
 T(degC)  ndat  dT/dt(degC/s)  dRH/dt(%RH/s)
    20.4   600        1.8e-09       -0.00012
    11.2   600       -3.6e-04        0.00160
     6.2   600       -1.8e-04        0.00130
     1.3   599       -1.8e-04        0.00073
    -3.6   600       -1.5e-04        0.00078
    -8.7   600       -2.0e-04       -0.00170
   -13.7   600       -1.7e-04        0.00094
   -18.7   600       -1.7e-04        0.00096
   -23.6   600       -1.8e-04        0.00050
   -28.5   600       -1.6e-04        0.00013
   -33.5   600       -1.7e-04       -0.00014
   -38.4   600       -1.7e-04       -0.00024
   -39.8   600       NA		    -0.00046
   -39.8   600       NA             -0.00052
   -39.8   600       NA             -0.00057
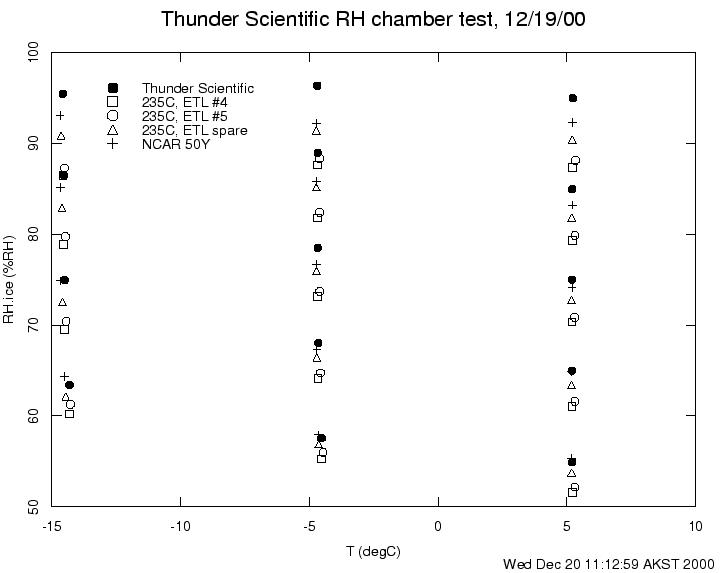
On 12-19-00 we calibrated the Vaisala capacitance hygrometers in the Thunder Scientific RH chamber. The calibrations were done at -15, -5 and +5 deg C and, at each temperature, data were collected at 4-5 humidities. The data are plotted as RH.ice versus temperature. The result is a somewhat odd looking plot, but it is not too hard to identify the related groups of data points.
The 50Y data are in best agreement with the chamber, possibly because this sensor was previously calibrated in this chamber. The 235C's read a little lower than the 50 Y and this is consistent with the results of the 12-15-00 frost point tests.
One aspect that I cannot explain is that the order of the data from the three 235C sensors appears to be opposite that of the frost point tests. Steve has looked again at the cabling and thinks that we are correctly associating each sensor with its data file. The sensors were placed in series in a manifold for the saturation tests but were exposed directly to the chamber atmosphere for the RH calibrations. Otherwise there were no changes, in particular to the wiring, between the two types of test.
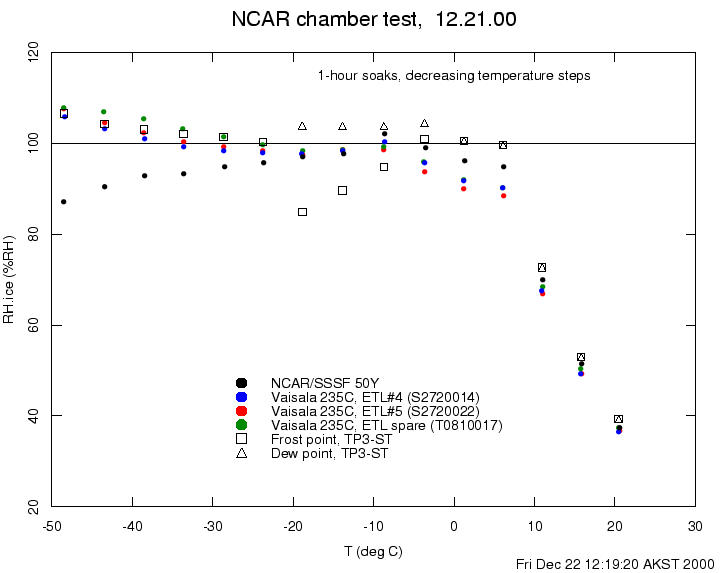
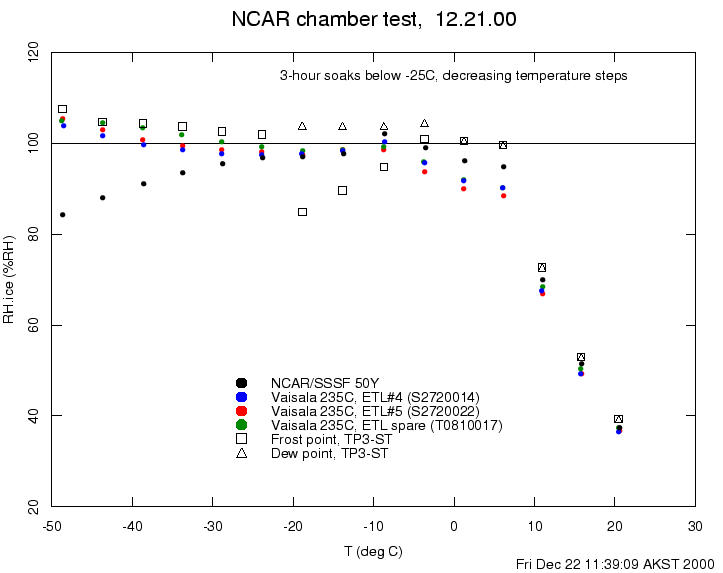
For this latest frost point test, the soak times below -30 C have been increased from 1 hour to 3 hours to see if there are any significant changes in the results. Plots of the data from this test are:
Some observations are as follows:
For decreasing temperature steps, the 1-hour soak time data look similar to the 12-15-00 frost point test, with the ETL "spare" 235C matching ETL #4 and #5 better than in the previous test. The 3-hour soak time below -25 produced slightly lower RH readings for the 235C and 50Y sensors, slightly higher RH readings for the dew point hygrometer.
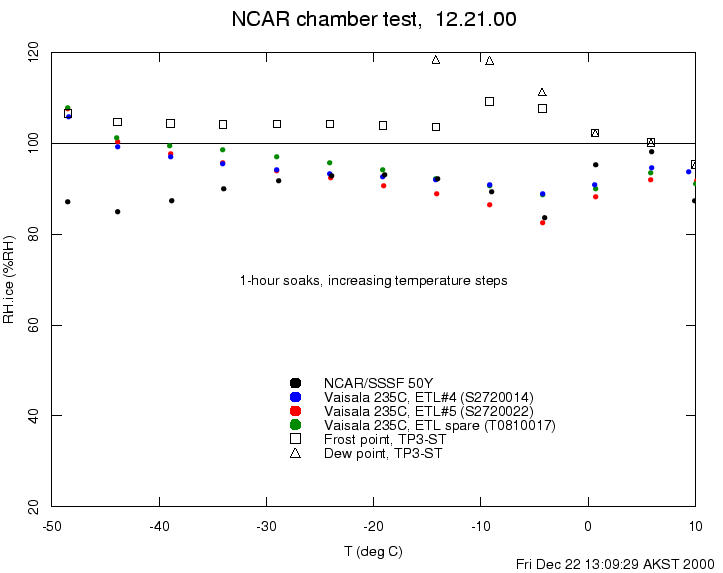
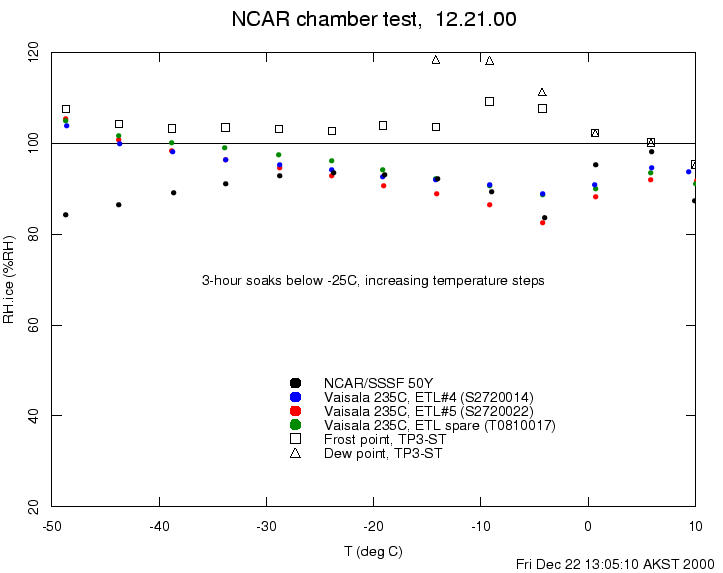
For increasing temperature steps, the dew point hygrometer indicates ~105% RH.ice at temperatures below -10C, the same as for decreasing temperature steps. However, now the mirror appears to stay at the frost point all the way up to 0 degC. RH.ice measured by the capacitance sensors is lower than for the decreasing temperature step data. This is particularly pronounced above -25C. RH.ice decreases with increasing temperature from -25C to -5C. This same trend is found in the decreasing temperature step data, but only above -10C. The differences between 1-hour soak times and 3-hour soak times are minor.
The difference between the downward-stepping and upward-stepping results is troubling. Note that the dew point hygrometer readings are generally consistent while the Vaisala sensors are not.
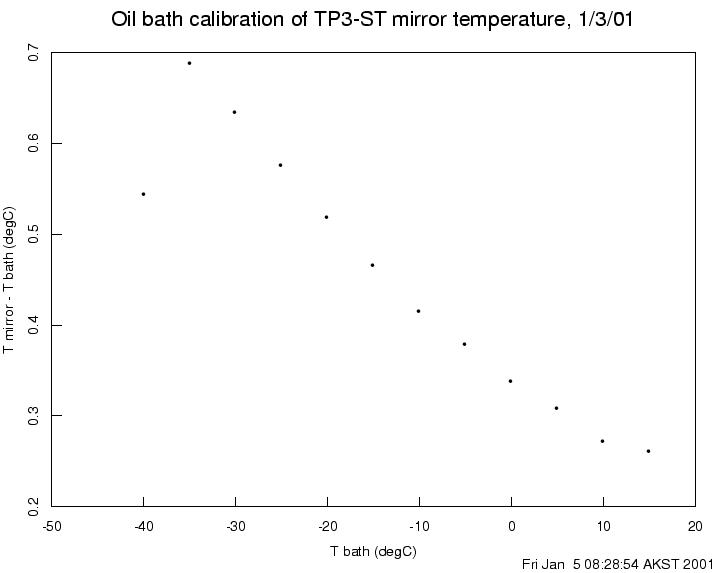
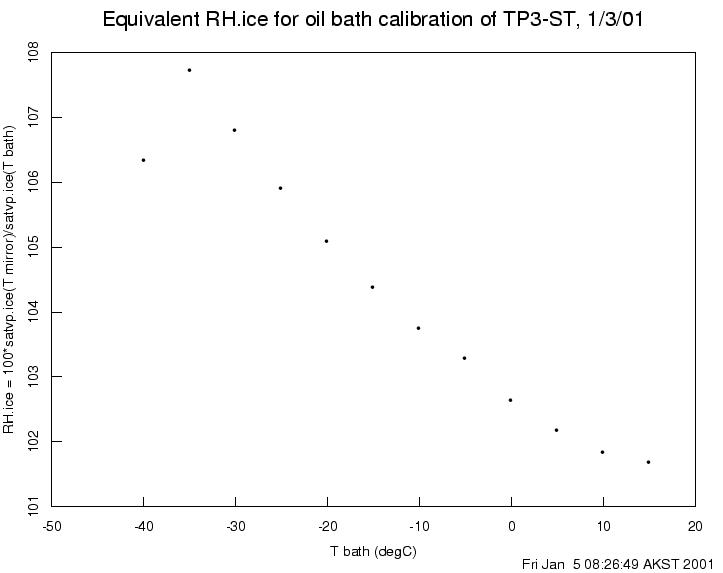
In order to confirm (or not) the dew point hygrometer data, the sensor unit (but not the control unit) was calibrated in a temperature-controlled oil bath. The results are plotted as the temperature difference between the mirror and the bath (or the temperature error of the mirror) versus the bath temperature. The mirror temperature is increasingly overestimated with decreasing temperature, which would cause an overestimation of the water vapor pressure and of the relative humidity. This is qualitatively consistent with both the Thunder Scientific calibrations of the dew point hygrometer and with the assumption that the frost point test environment is saturated wrt ice.
There is an anomolous data point at -40 C that appears to be a 'glitch' in the dew point hygrometer reference temperature. If the reference temperature at -35 C is used to calculate the mirror temperature at -40 C, then the data point at -40 C follows the trend of the data at lower temperatures. Unfortunately, there is no known rationale for following this procedure other than making the data look better.
The temperature data have been converted to RH.ice by assuming that the oil bath temperature corresponds to the ambient air temperature,
RHice = 100*satvp.ice(T mirror)/satvp.ice(T bath)
where satvp.ice is the saturation vapor pressure wrt ice. A plot of RH.ice versus oil bath temperature shows that the errors in the mirror temperature produce errors in RH.ice at the frost point that are commensurate with the Thunder Scientific calibration of the dew point hygrometer, an overestimation of RH.ice by 2-3% RH above freezing and an overestimation of 3-4% RH down to -20 C. However, the inferred errors in RH.ice below -20 C are perhaps twice the magnitude of the super-saturated values of RH.ice measured in the frost point tests. It should be noted that the results of this test could only be used to quantitatively correct the dew point hygrometer data from other tests if the dew point reference temperature were the same in both cases.
One caveat to the previous frost point tests is that the Vaisala sensors are in a common manifold, but the dew point hygrometer is in a separate enclosure immediately downstream of the manifold. Another caveat is that the Vaisala temperature readings in the manifold are used to convert the dew/frost point measurements to RH. It is certainly possible that the temperature and/or vapor pressure might be different in these two chambers, but a mechanism for causing that is not clear.
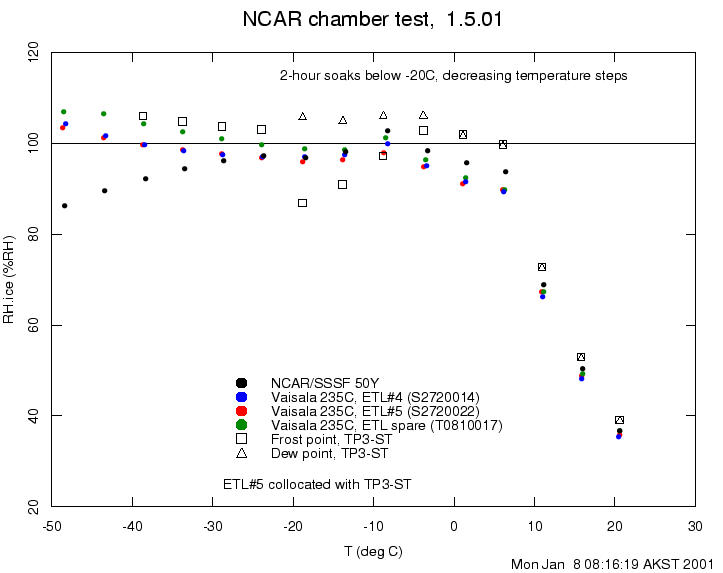
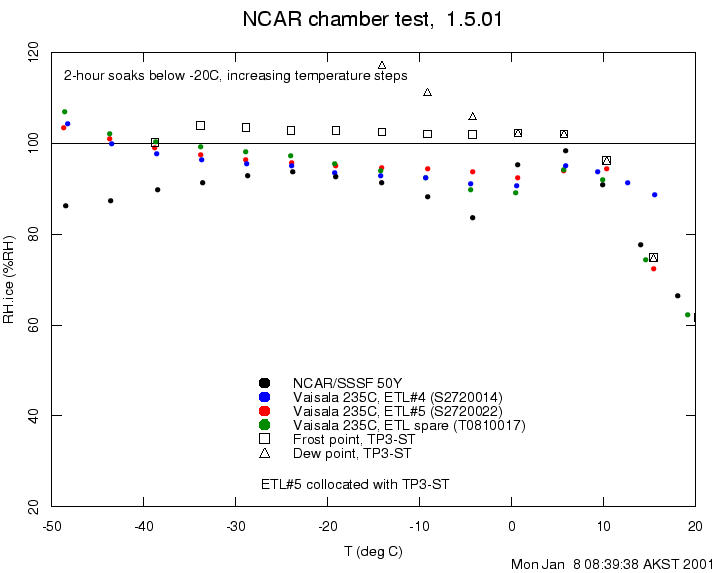
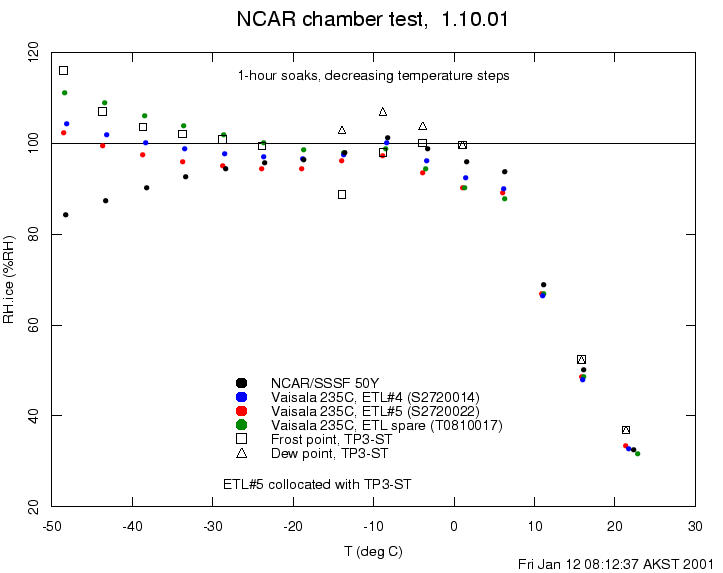
Another frost point test was run on 1-05-01 with the ETL 235C #5 collocated with the dew point hygrometer. For these tests the soak times below -20 C were 2 hours. Plots have been made for both the decreasing and increasing temperature steps. These results are generally quite similar to the results of the 12-21-00 frost point tests. In particular, these results confirm that the temperature and relative humidity in the dew point hygrometer chamber are very similar to the environmental conditions in the upstream manifold.
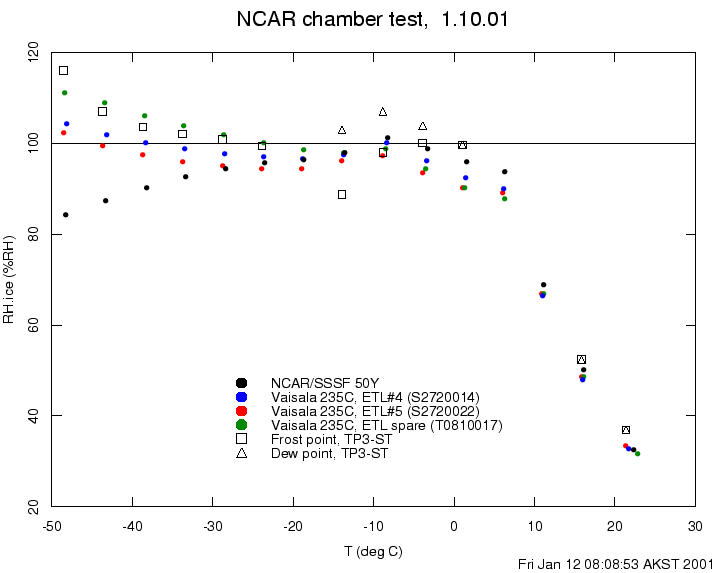
The frost point test data have been changing from 12-15-00 to 1-05-01. One possible explanation would be contamination of the capacitance sensors and the dew point hygrometer mirror. Thus all sensors were cleaned with distilled water and another frost point test was run. The test started with a 1 hour soak at 50 C with the intent of additionally cleaning the sensors. This test returned to the original 1-hour soak times, but included both decreasing and increasing temperature steps. Note that the dew point hygrometer data was bad during the decreasing temperature steps at -20, 5 and 10 C.
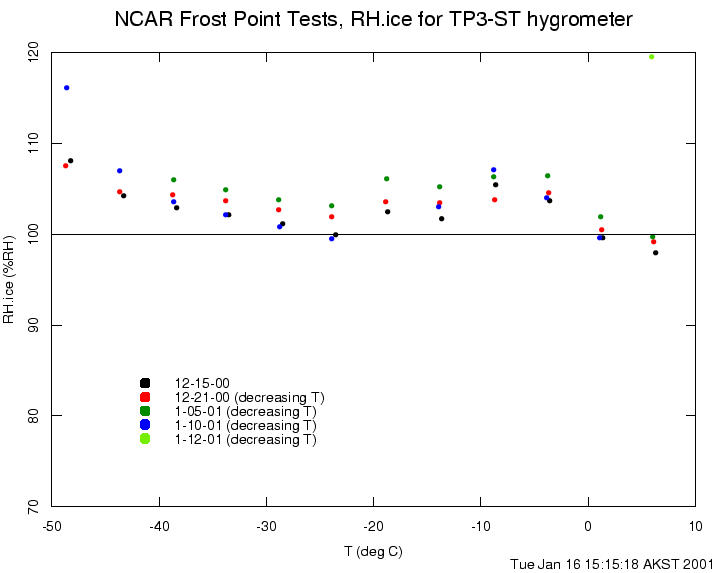
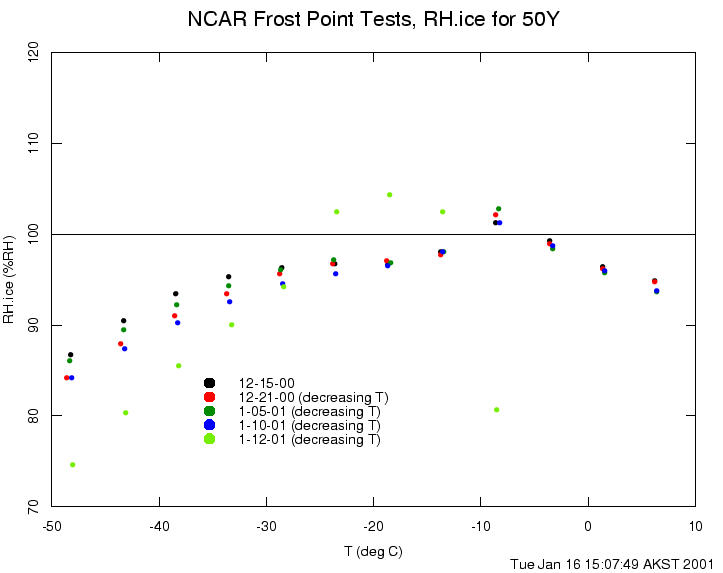
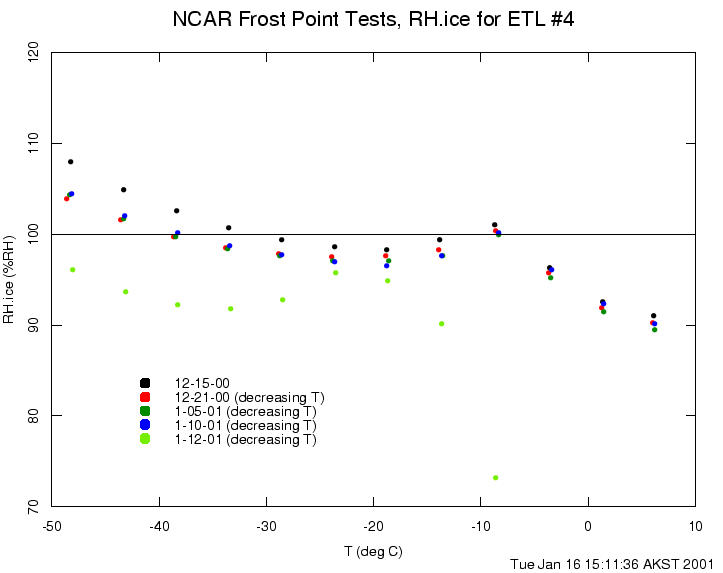
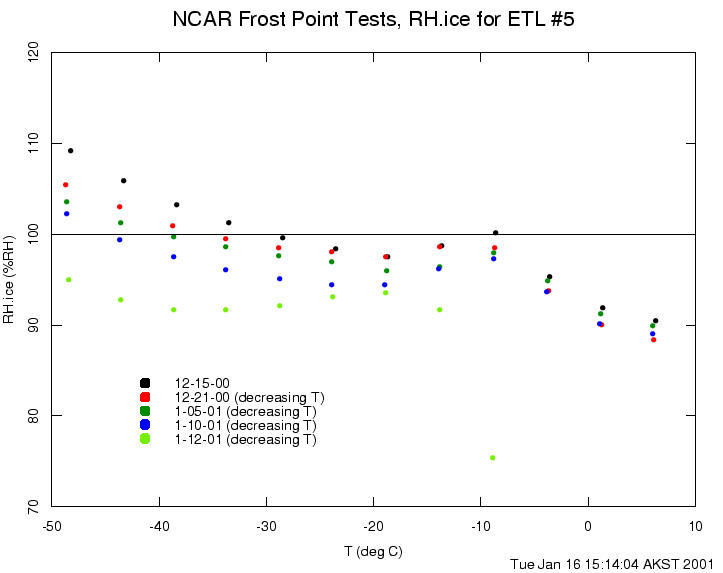
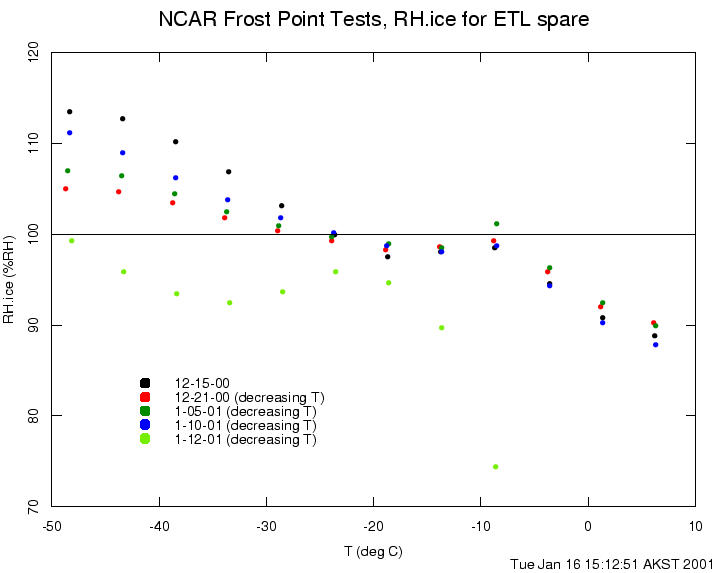
In order to compare the data from the four frost point tests, the same plot format has been used, but segregated by hygrometer rather than by test. The following observations can be made regarding the changes of the data for each instrument from test to test:
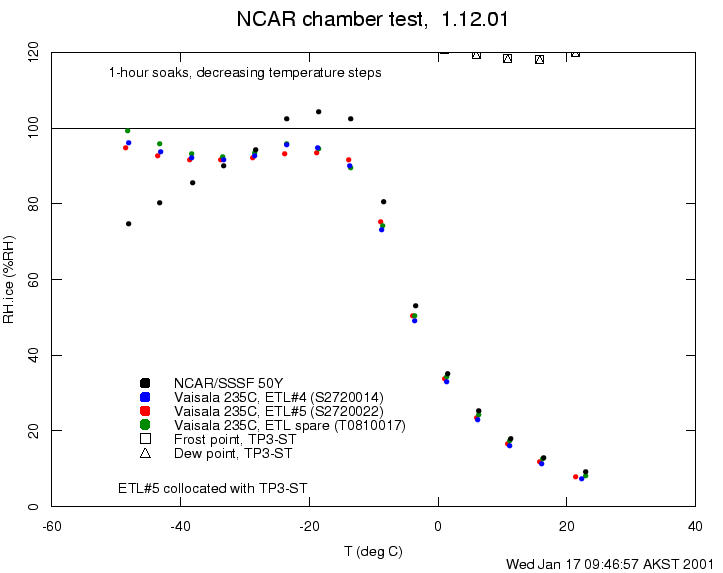
Following a meeting with Chris Fairall and Ola Persson to discuss the laboratory tests, Chris suggested that the data may indicate that the water vapor content of the air supplied to the temperature chamber for the frost point tests may be too high to avoid super-saturation at temperatures below -30 C. All previous test have used air at 20 C and 40% RH. For the following test, this was reduced to 0 C and 40% RH, which was selected in order to reach saturation wrt ice at -20 C. In addition, the length of the tubing within the temperature chamber upstream of the capacitance sensor manifold was increased from about 3 ft to about 15 ft in order to provide additional time and surface area for the air to reach equilibrium wrt ice.
The data from this latest test have been plotted for both decreasing and increasing temperature steps. The 235C capacitance sensors now read sub-saturation wrt ice, as Chris speculated. Unfortunately the dew point hygrometer appears to have a problem in this test. Above 0 C it read 120% RH and then recorded even higher super-saturations below 0 C.
The data from this test have been added to the summary plots for the individual sensors referenced in the preceding discussion of the 1-10-01 test. My conclusion is that we apparently need a reliable water vapor standard for these tests and cannot just assume 100% saturation wrt ice.
| Table of Contents | Previous | Top |