


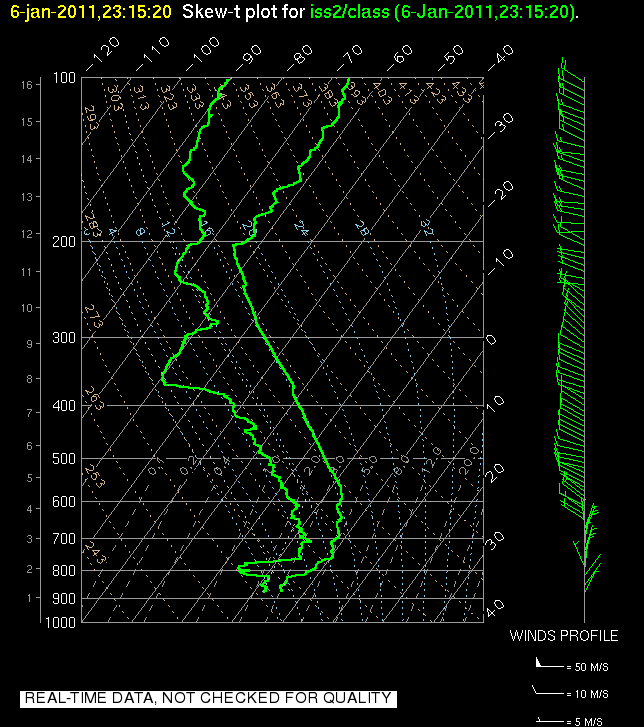
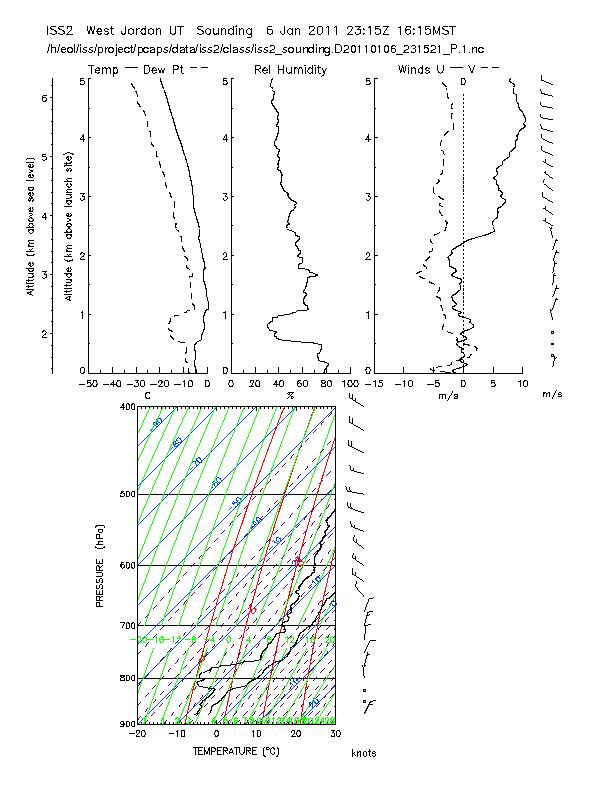
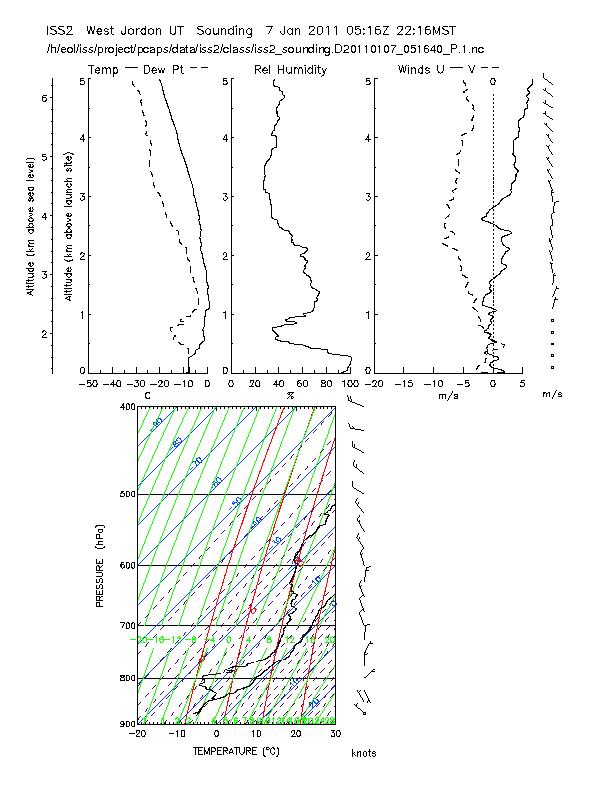
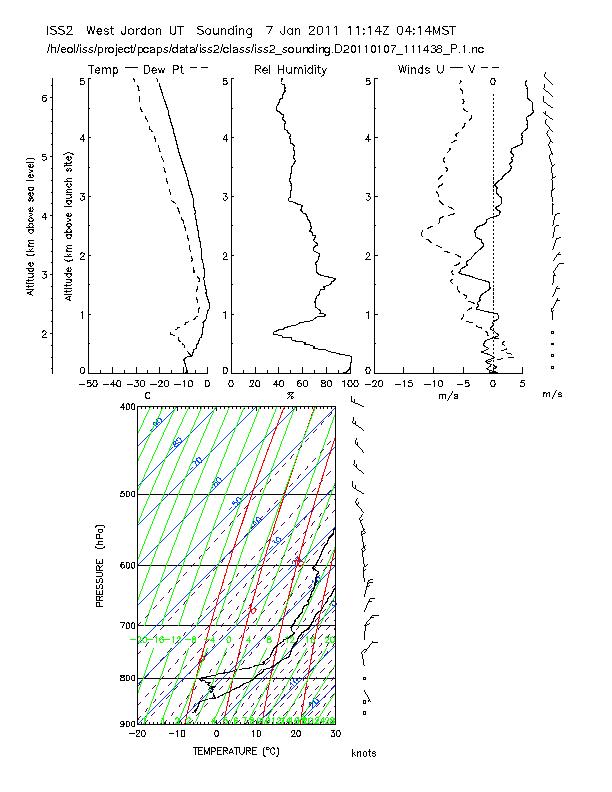
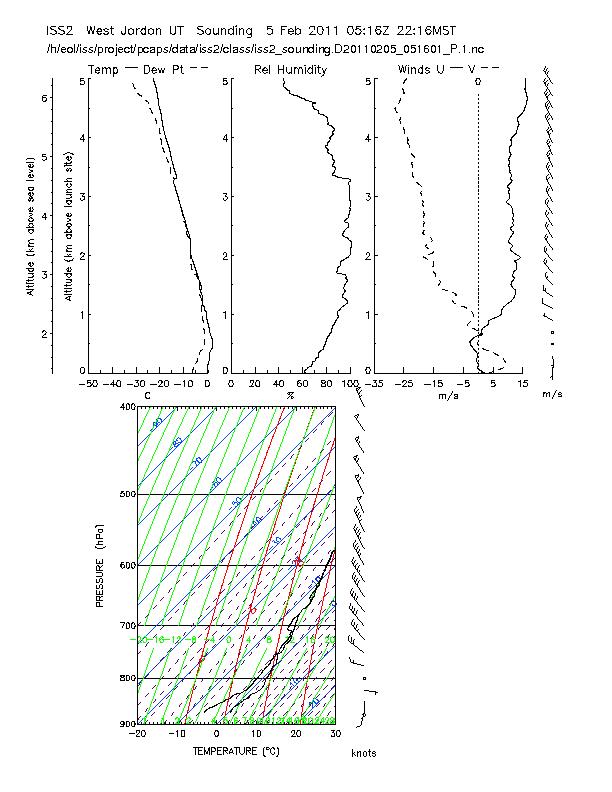
NCAR/EOL ISS / GAUS Radiosonde Soundings made in support of the PCAPS project. (See the ISS PCAPS web page).
This table links to two plots for each sounding :
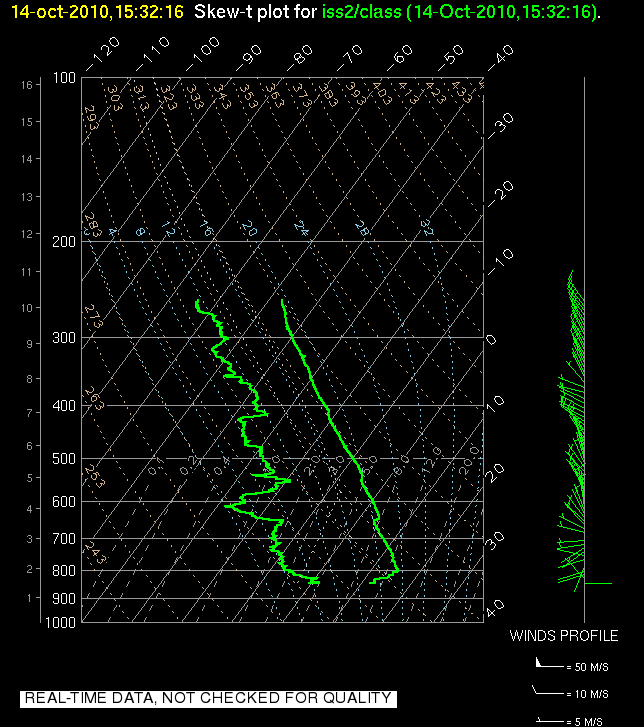
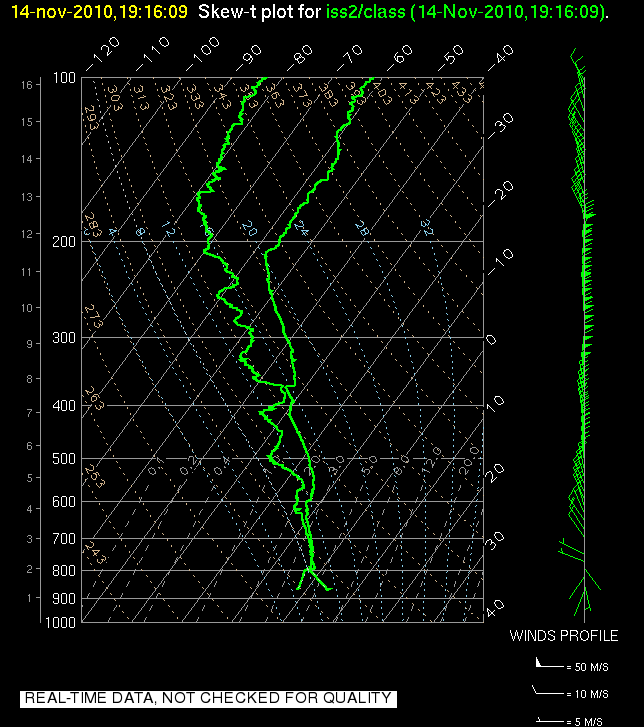
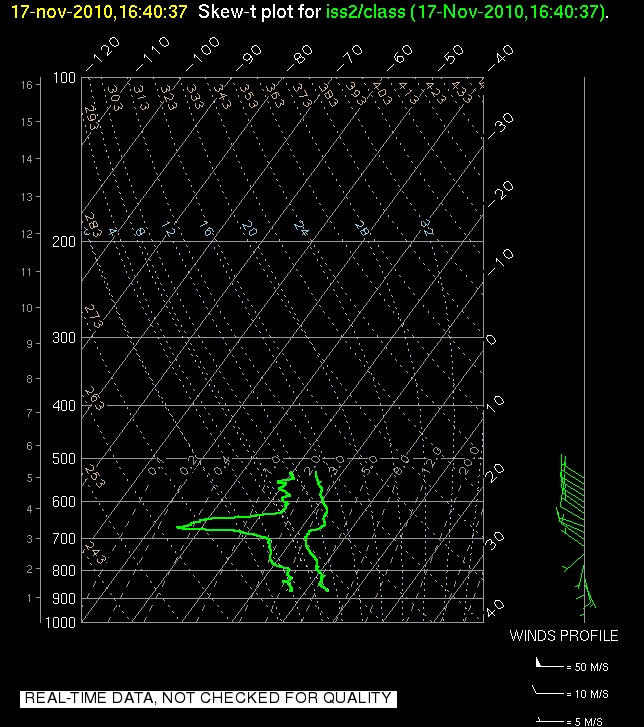
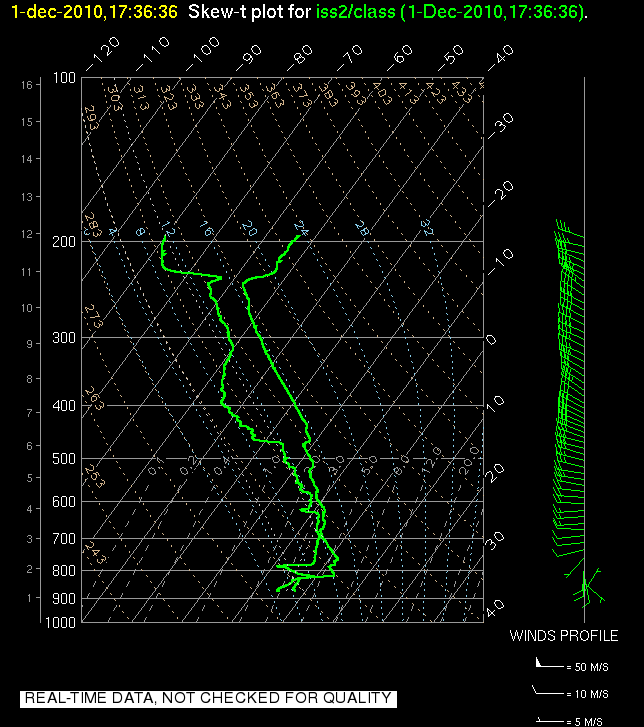
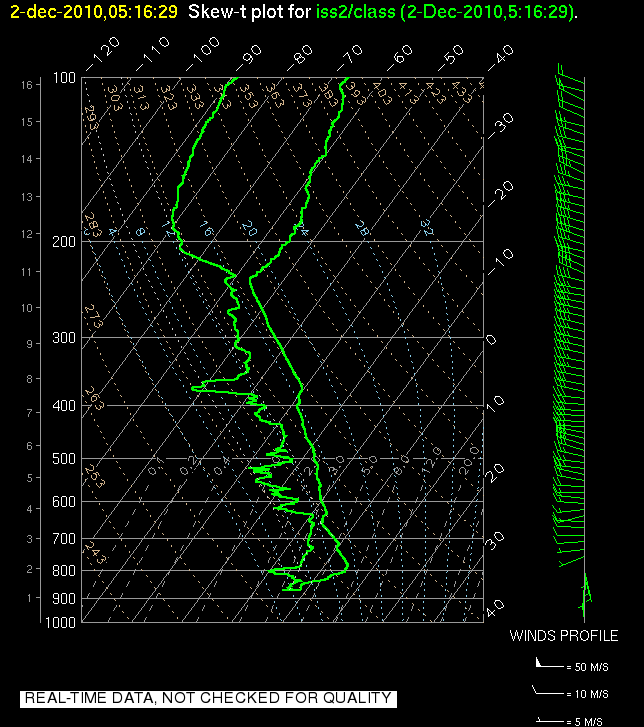
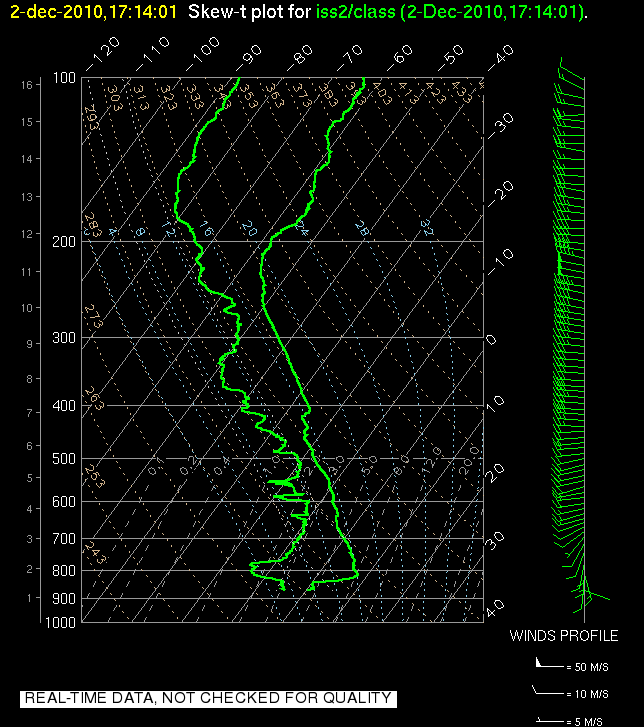
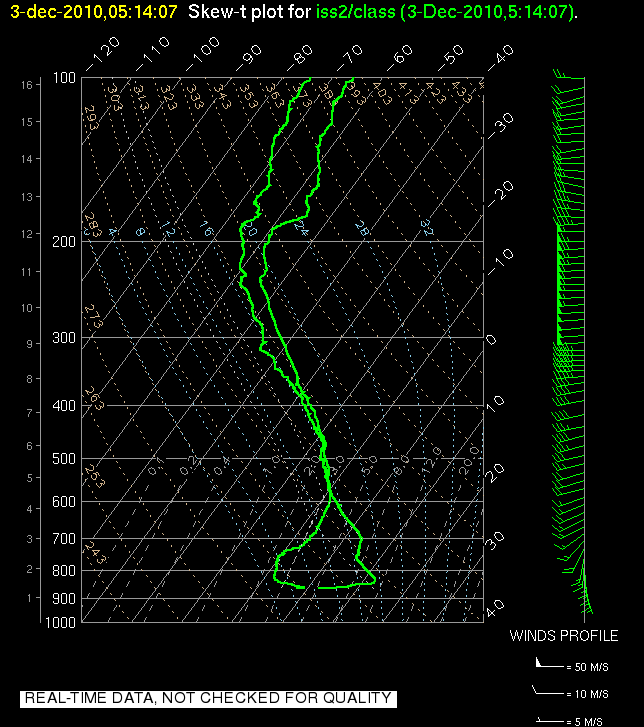
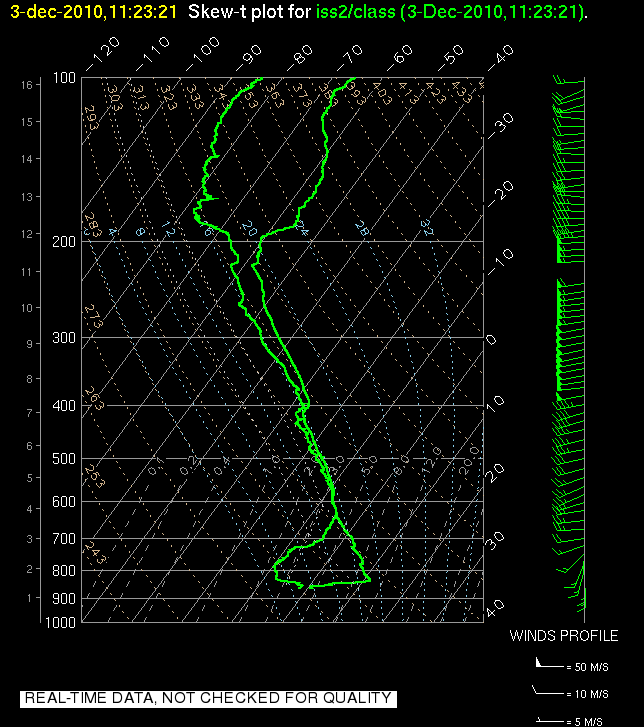
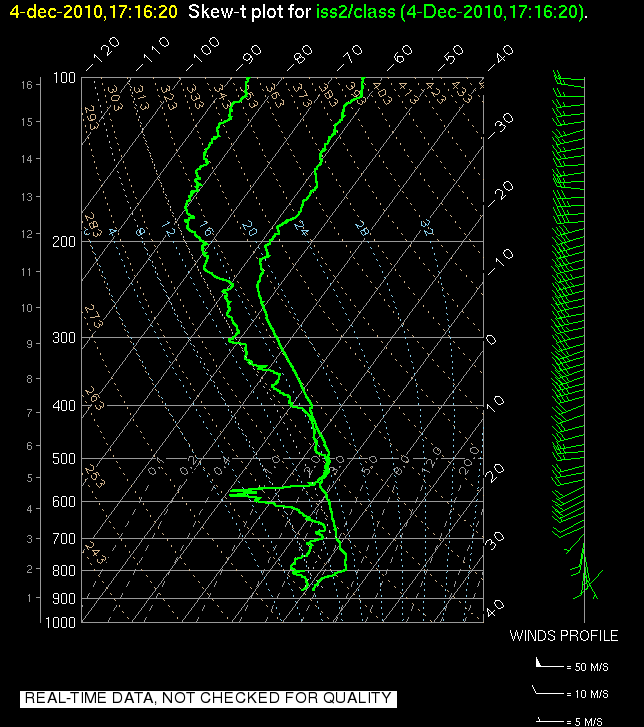
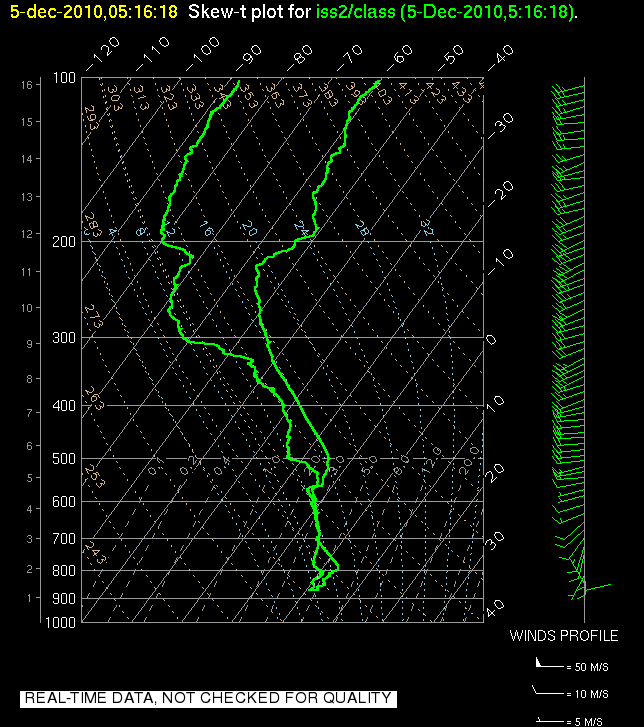
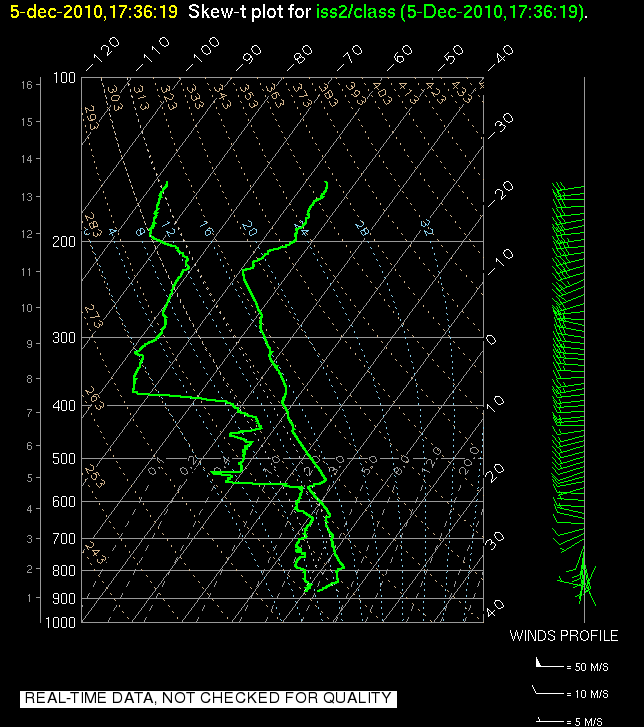
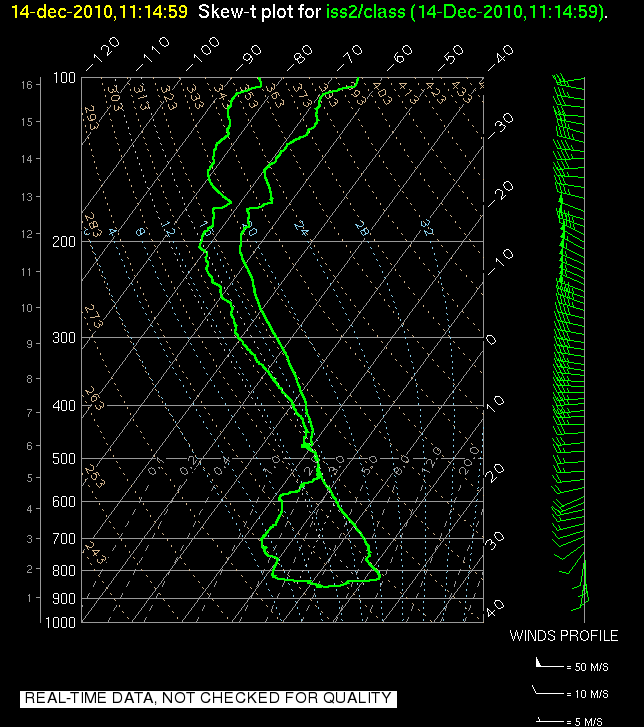
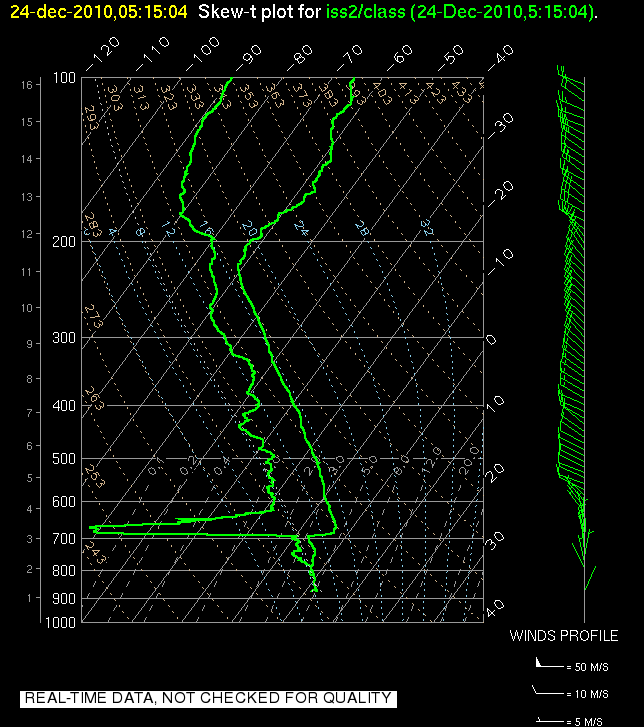
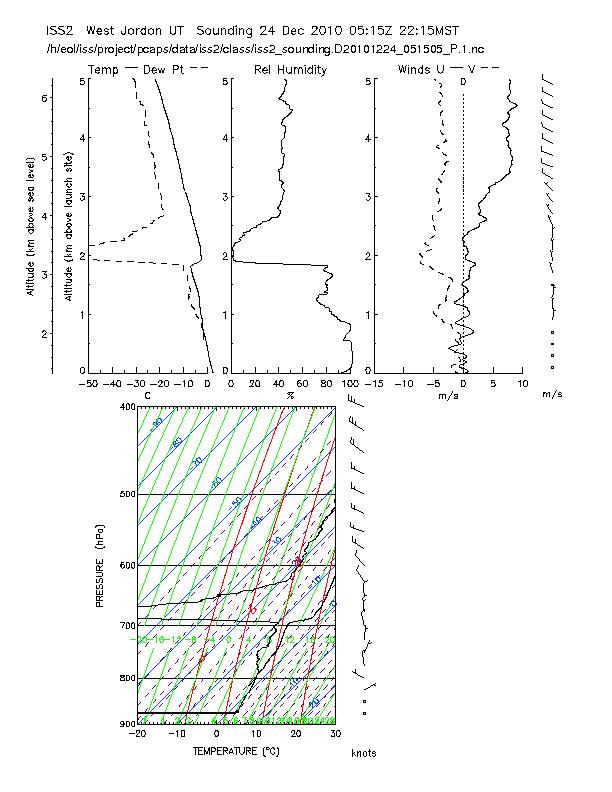
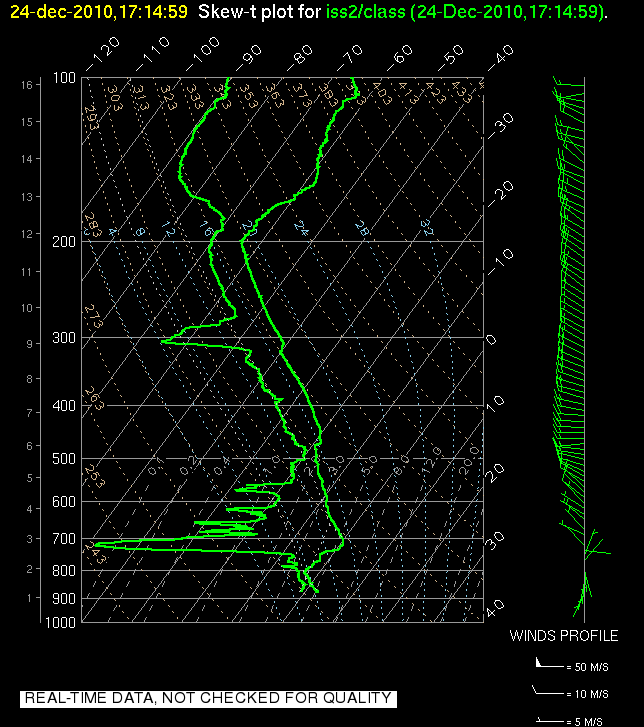
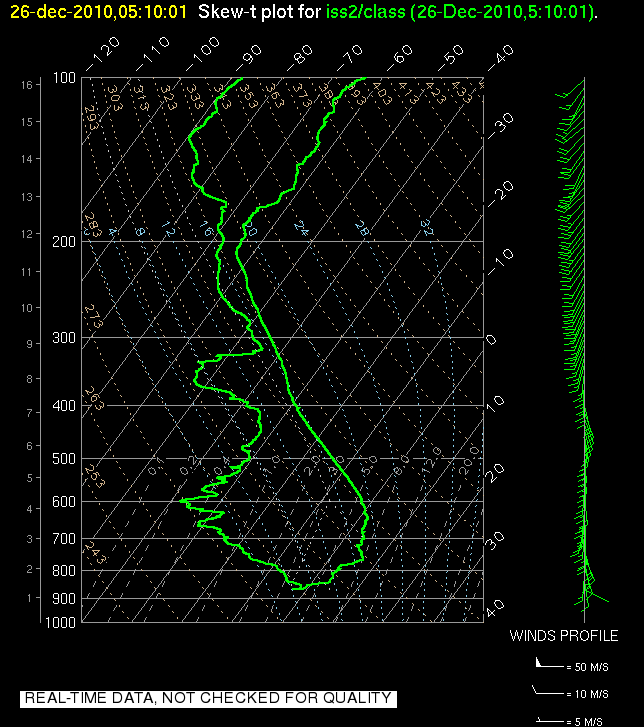
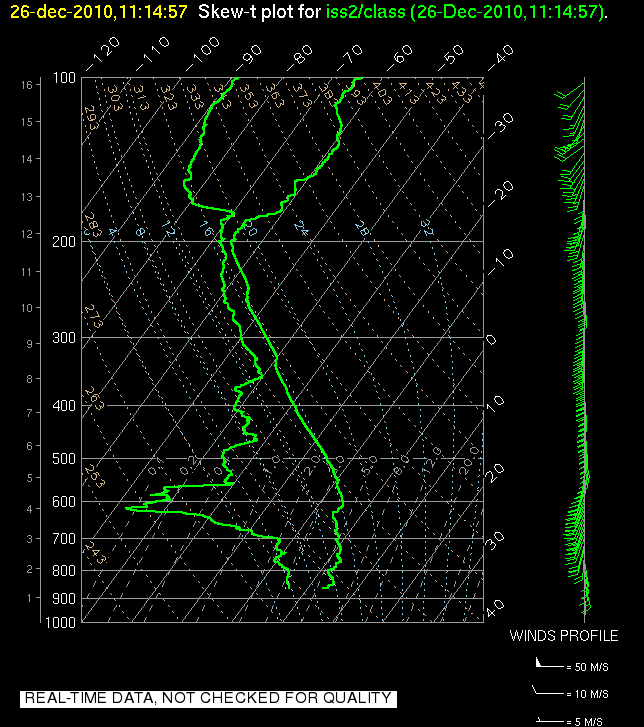
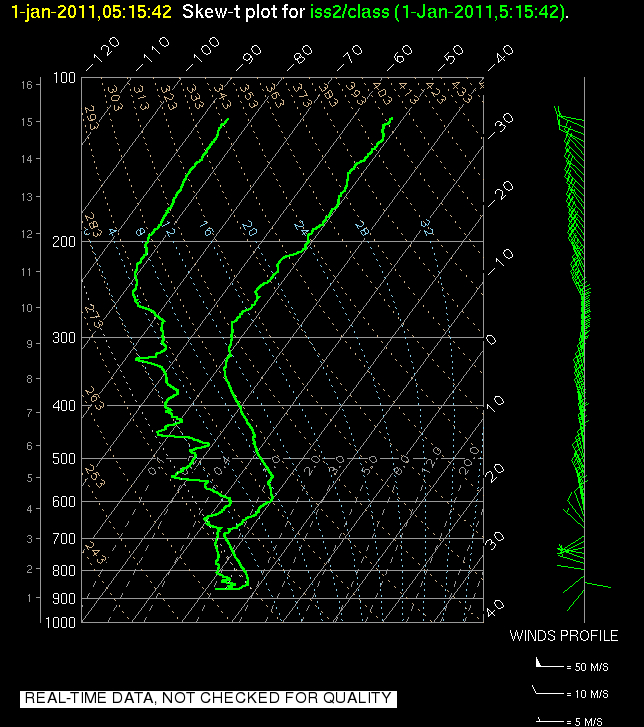
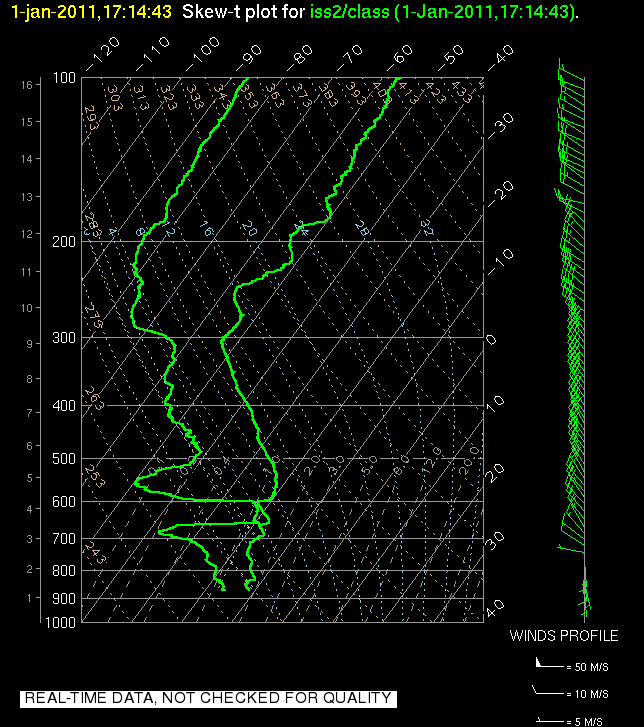
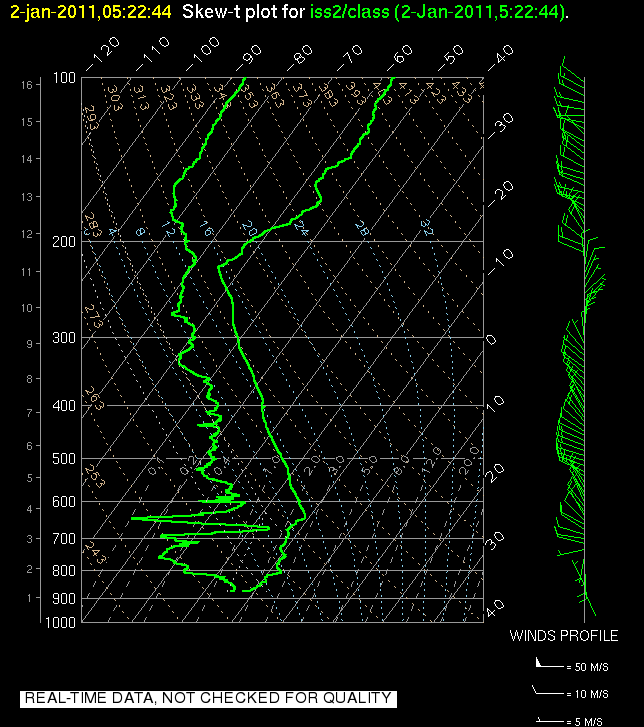
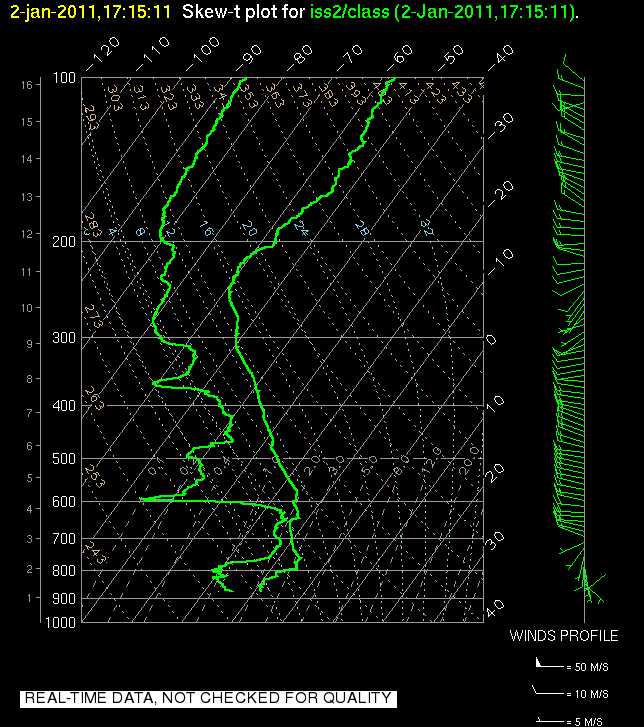
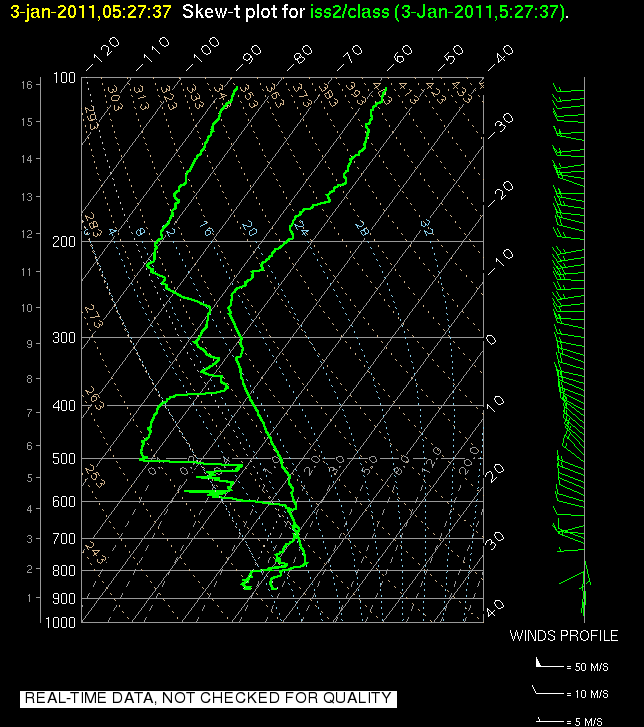
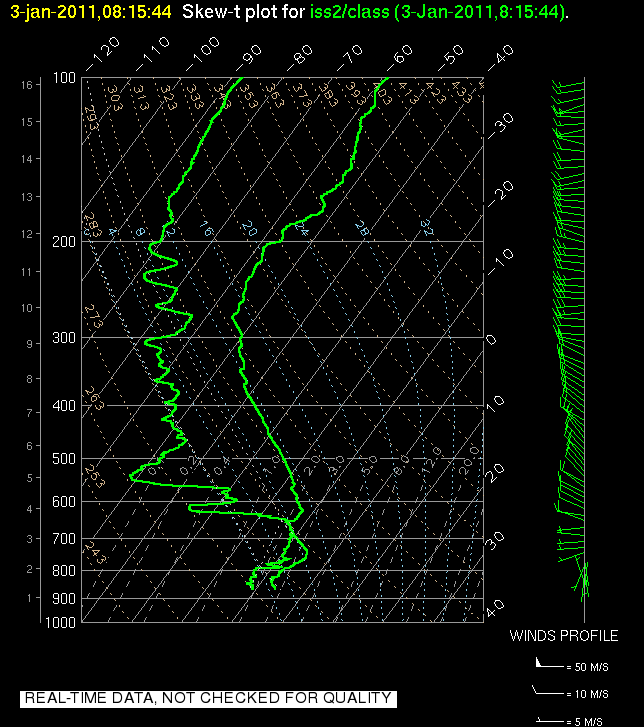
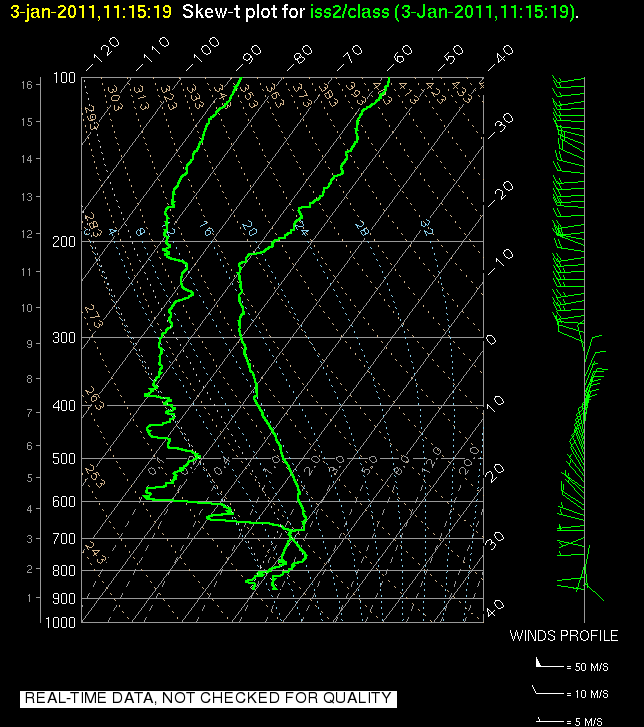
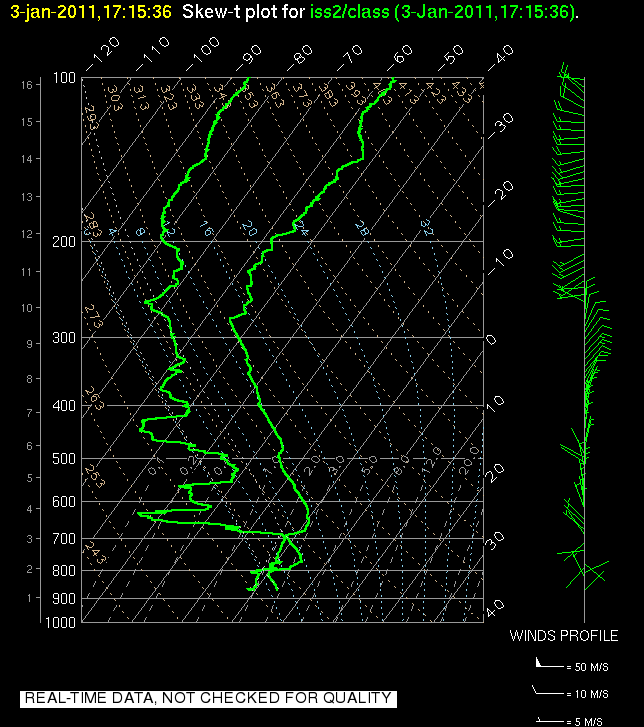
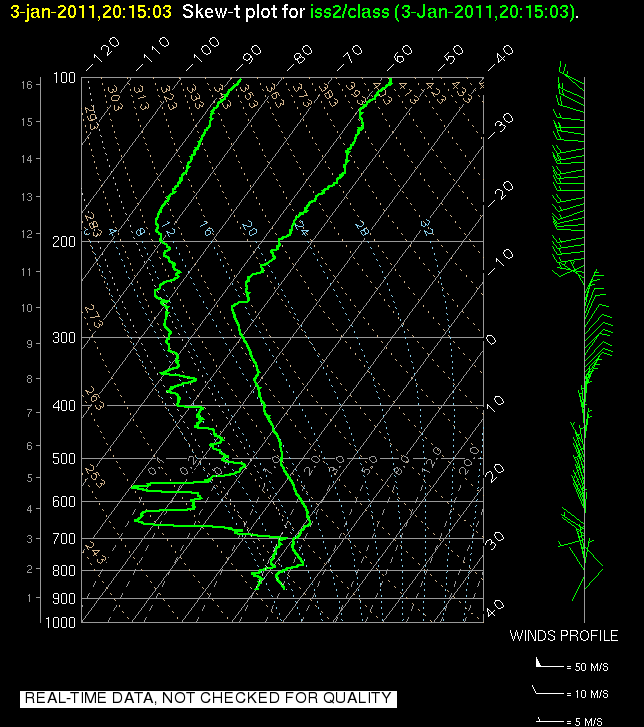
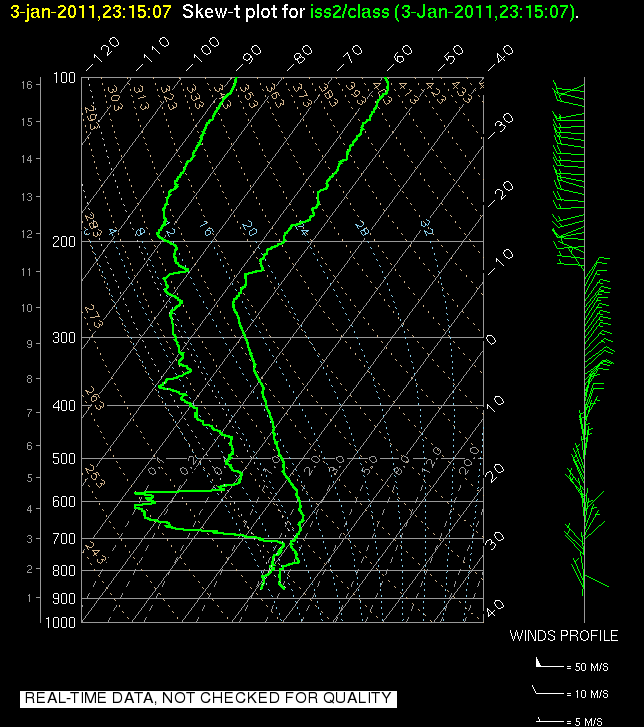
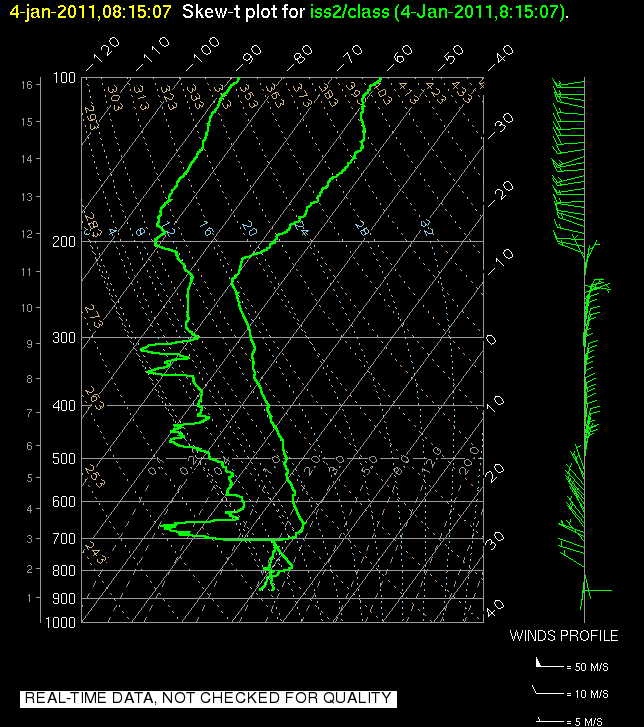
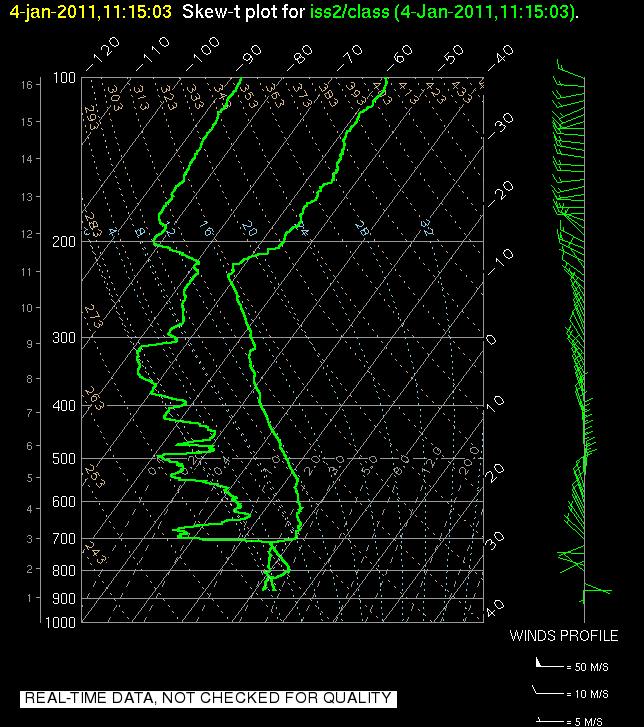
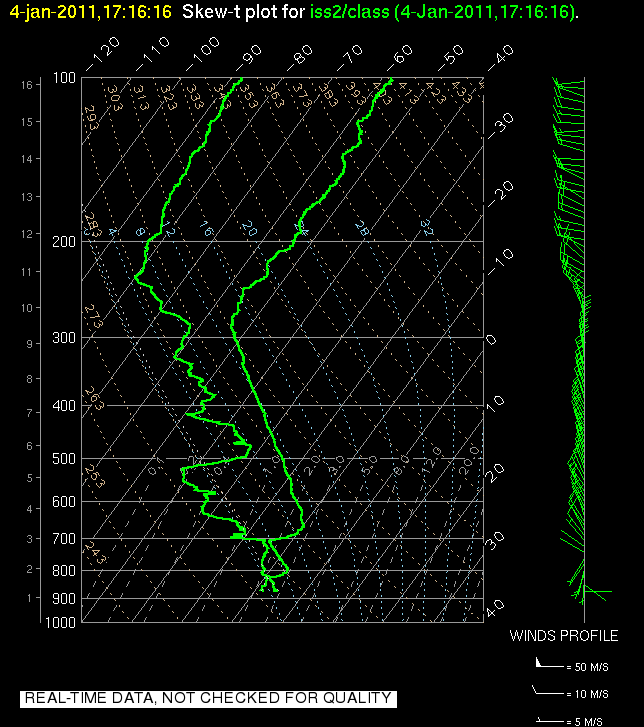
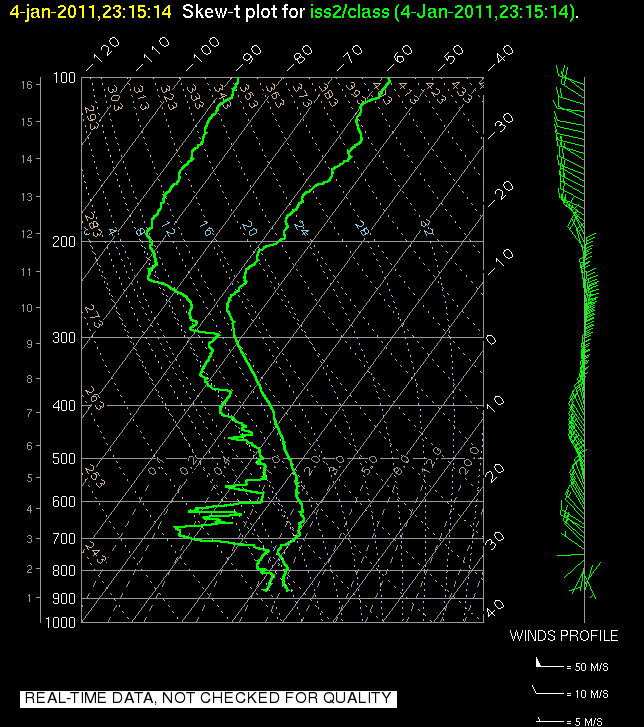
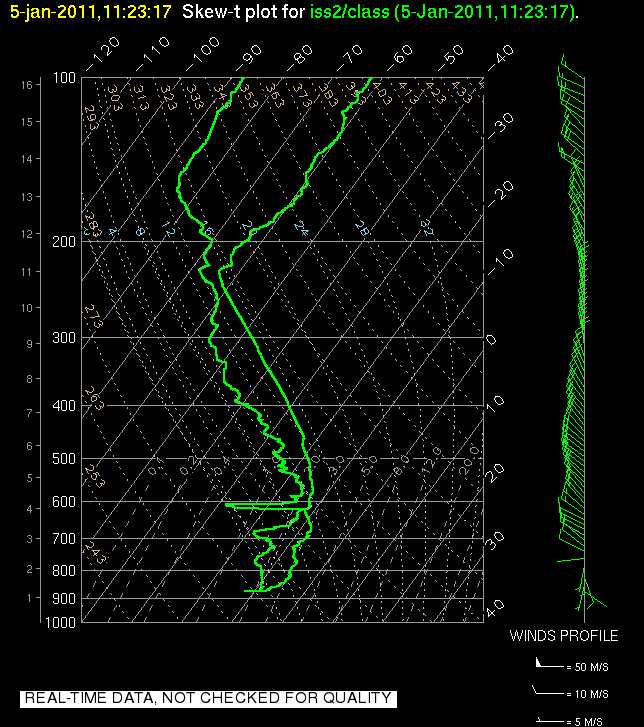
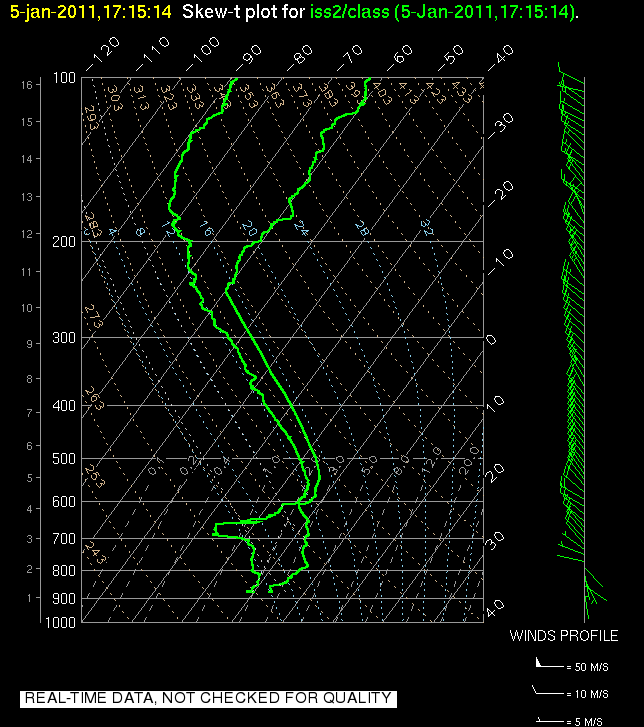
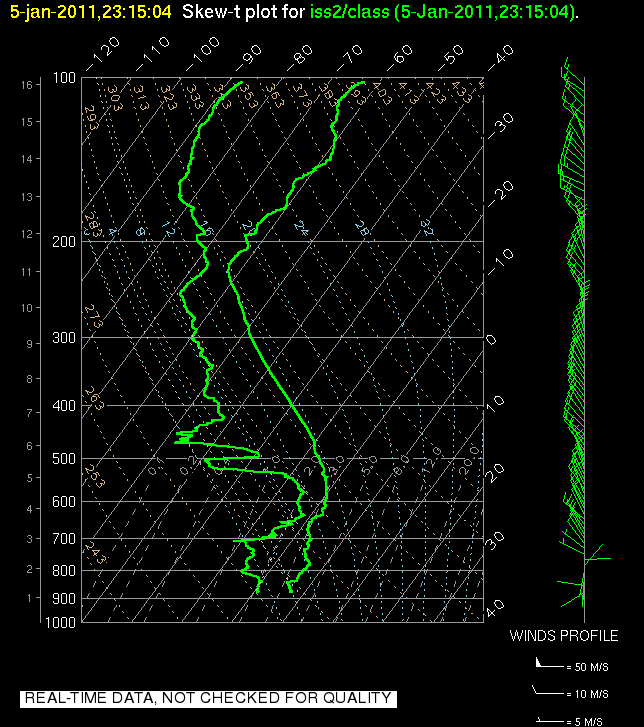
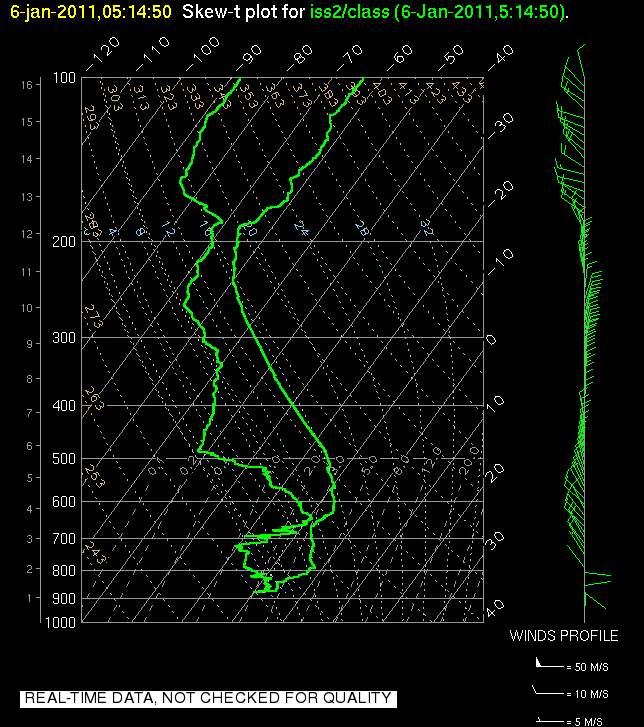
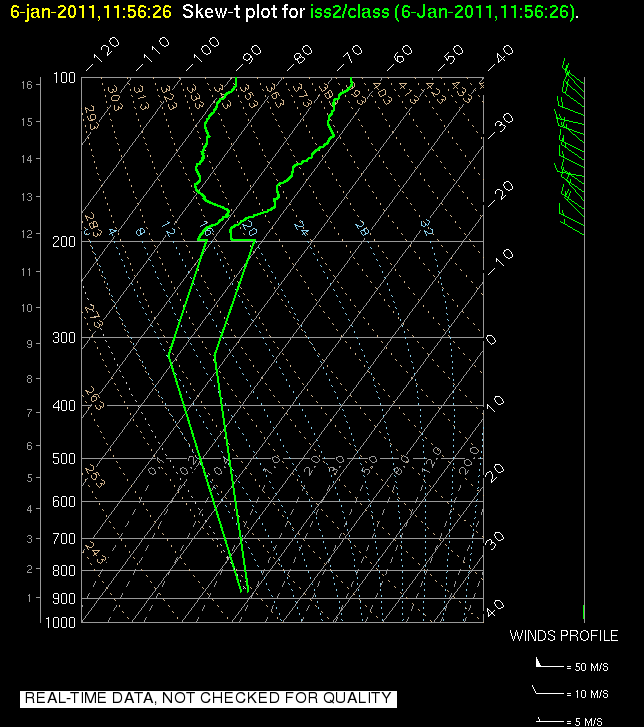
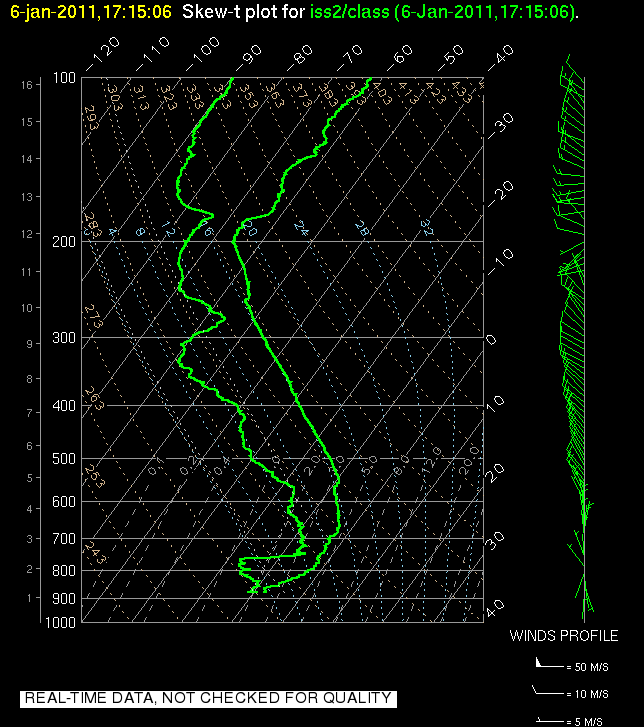
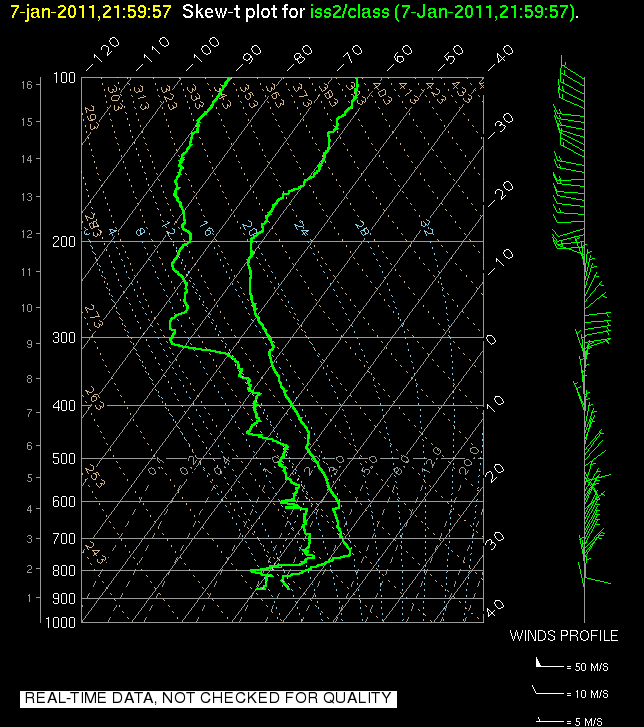
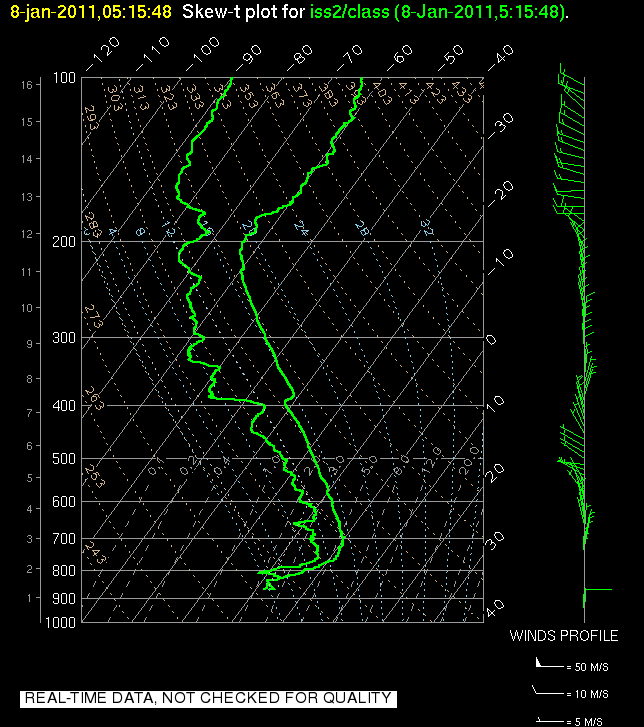
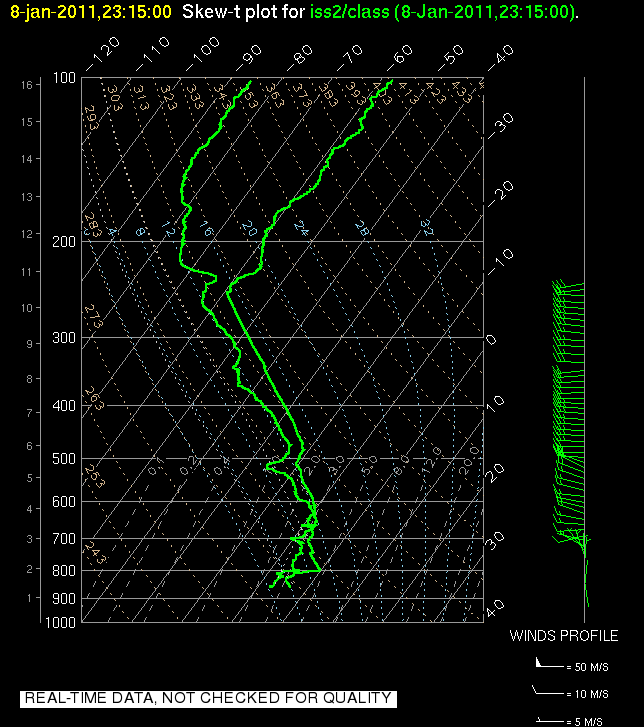
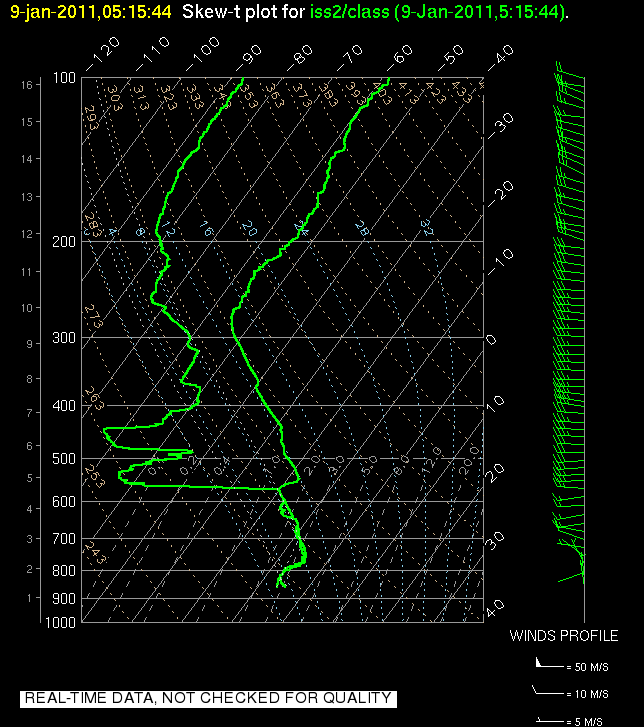
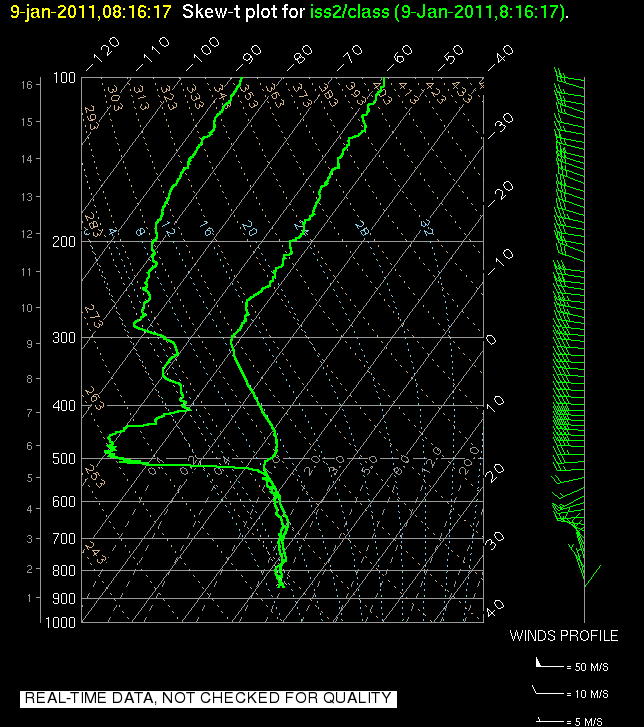
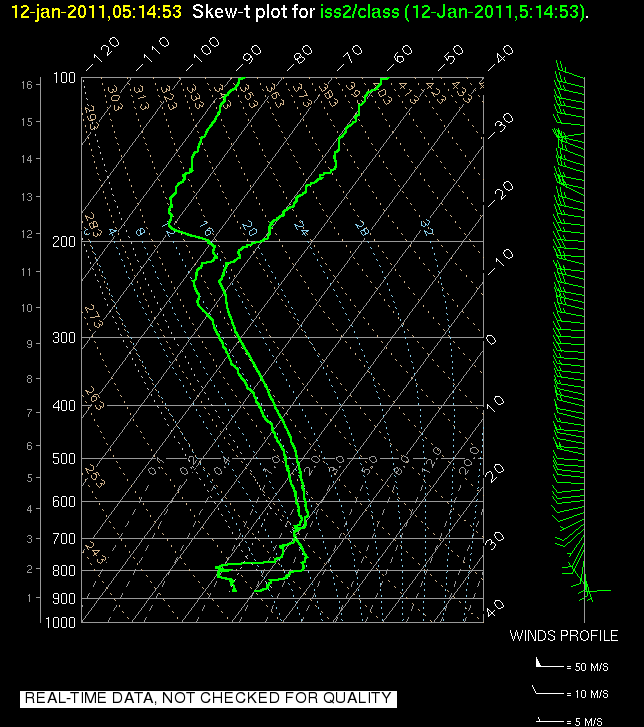
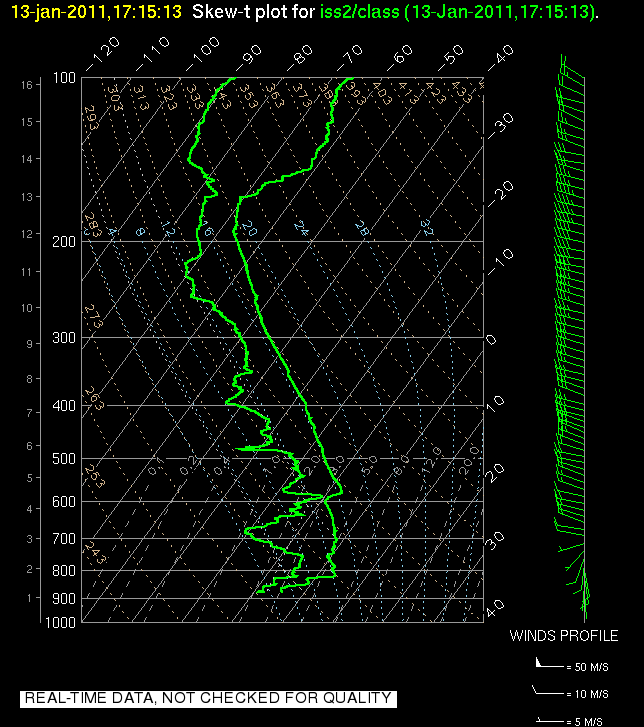
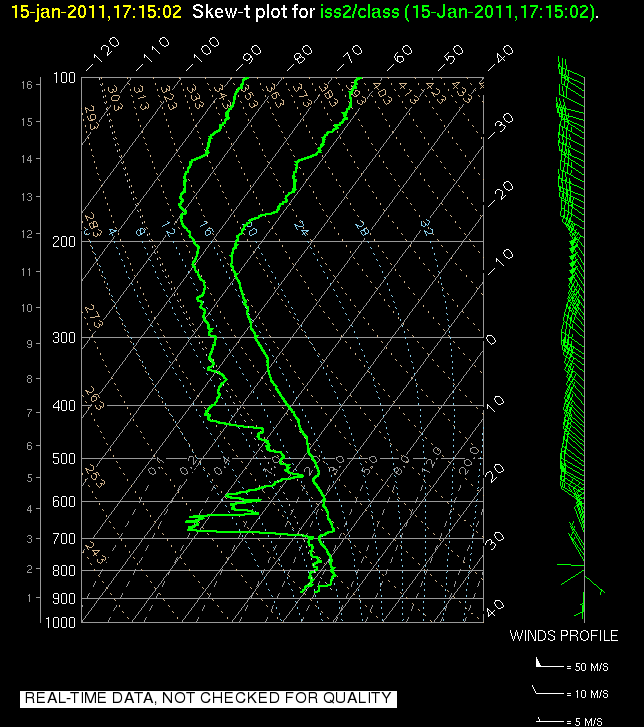
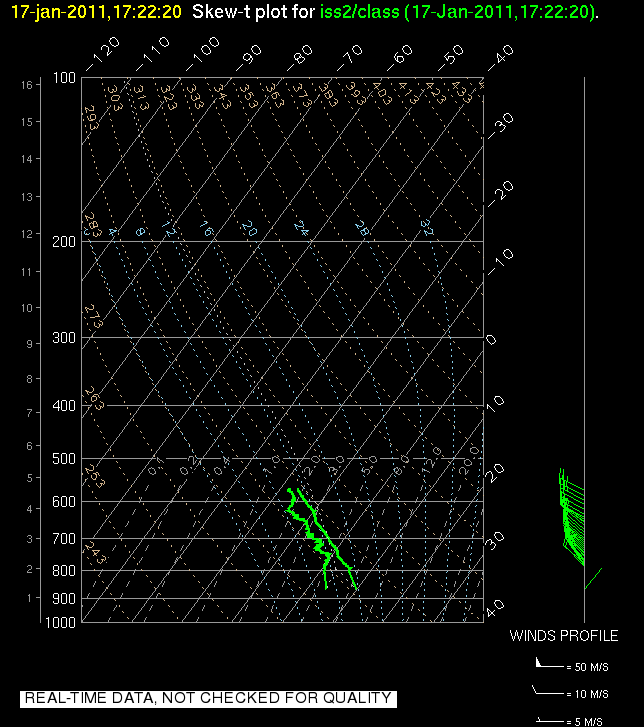
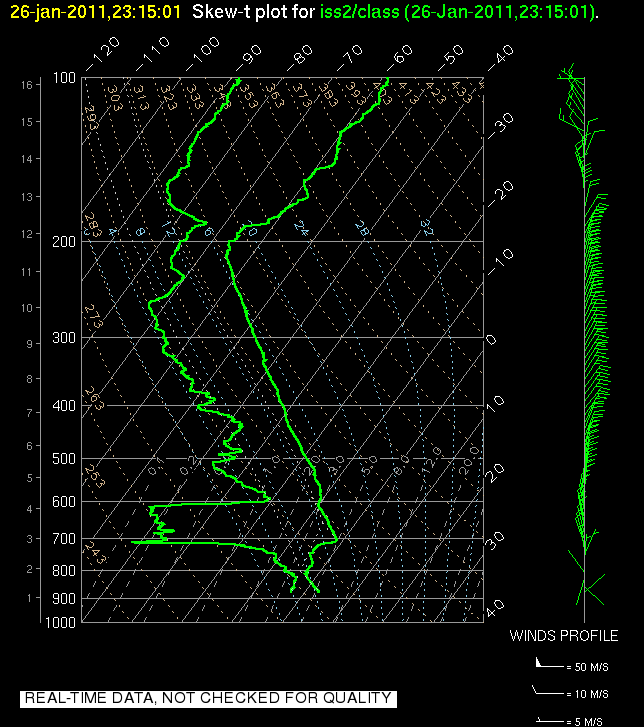
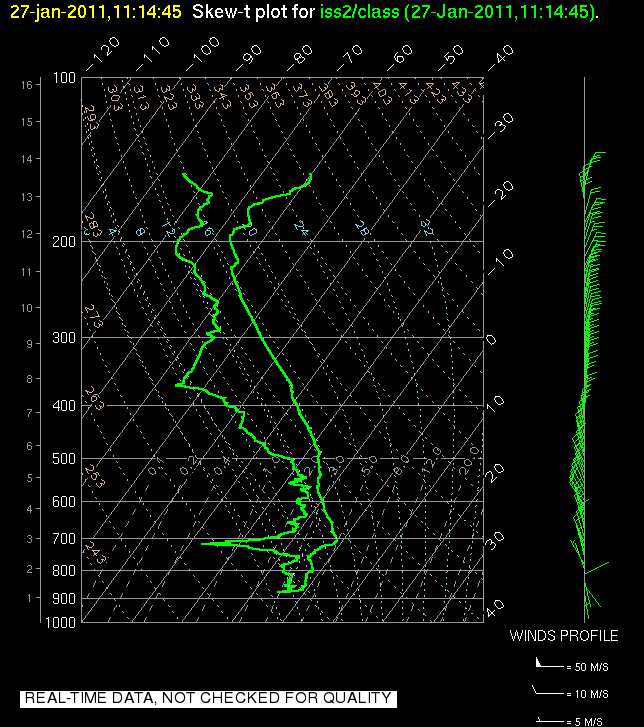
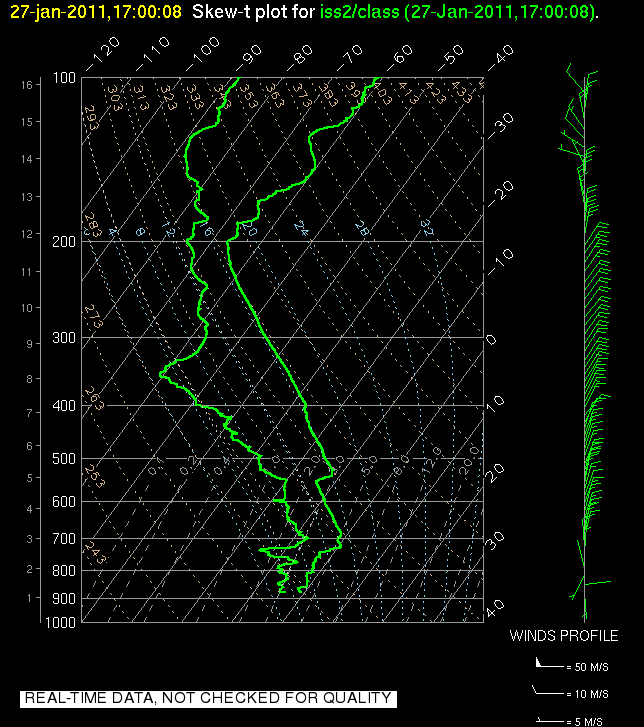
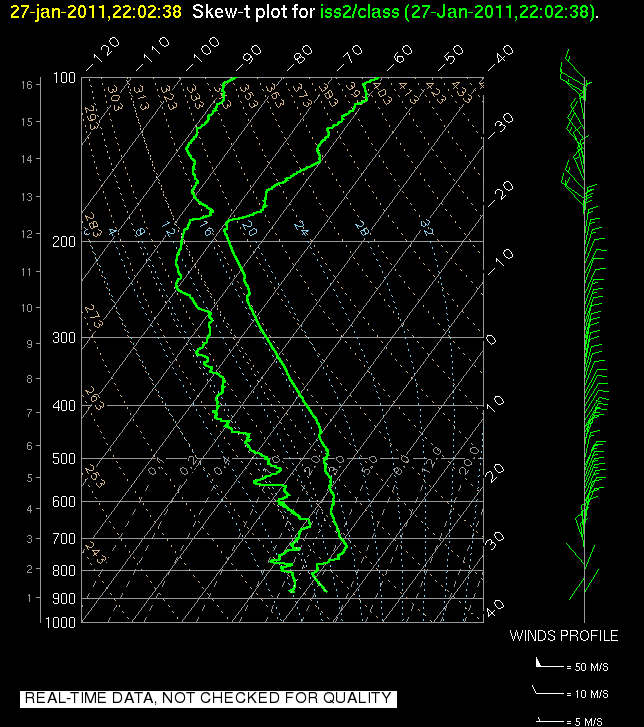
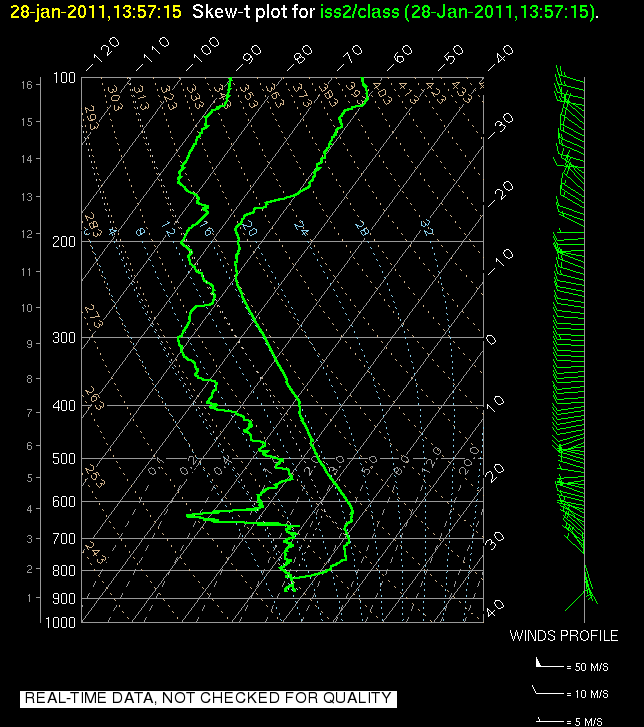
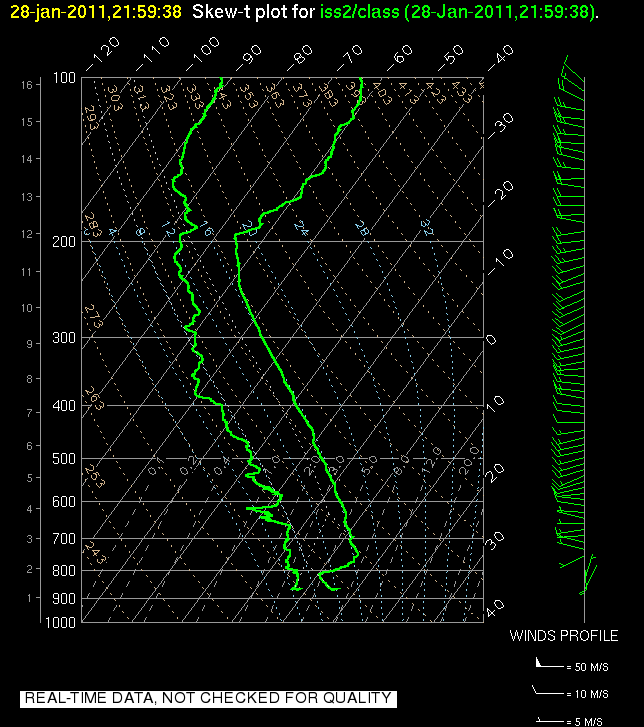
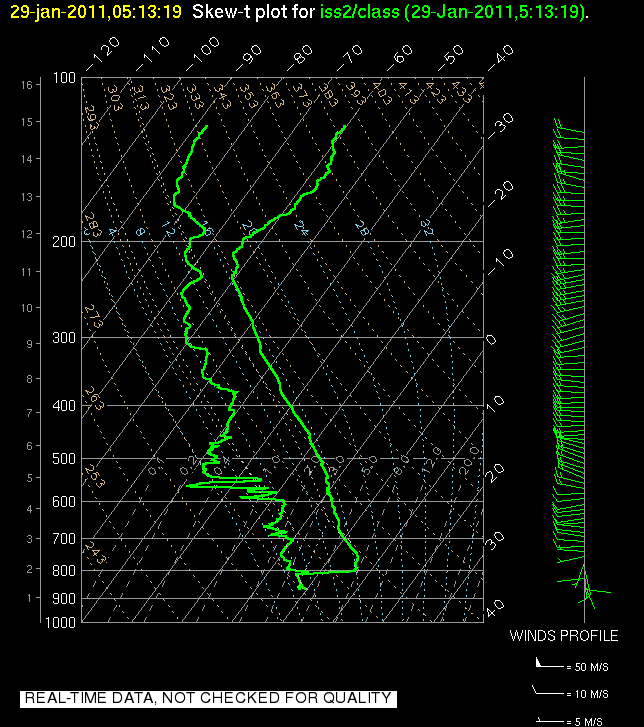
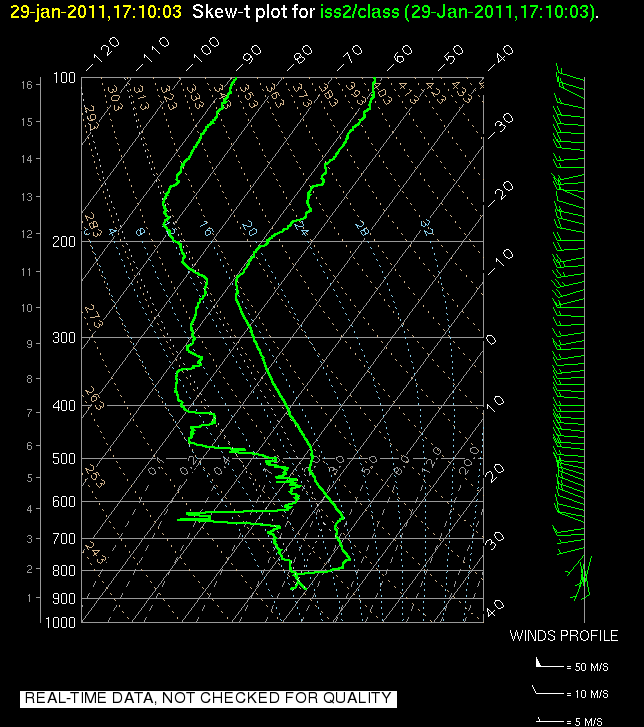
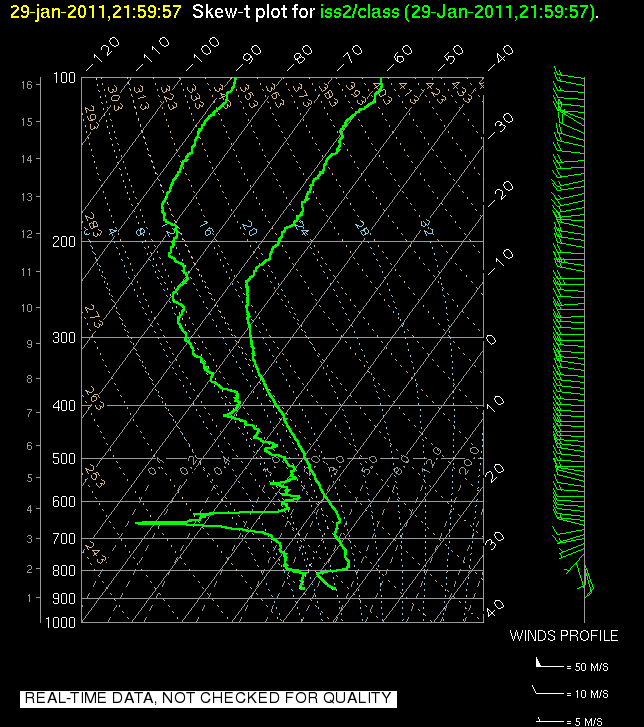
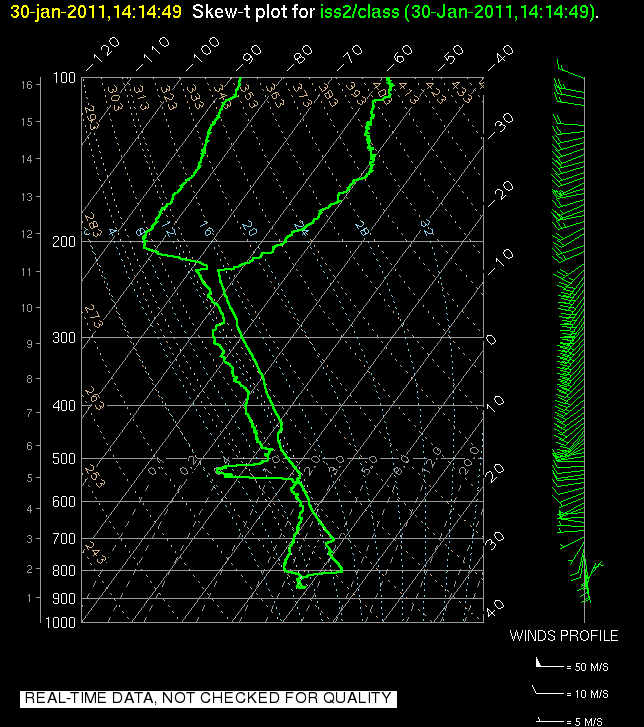
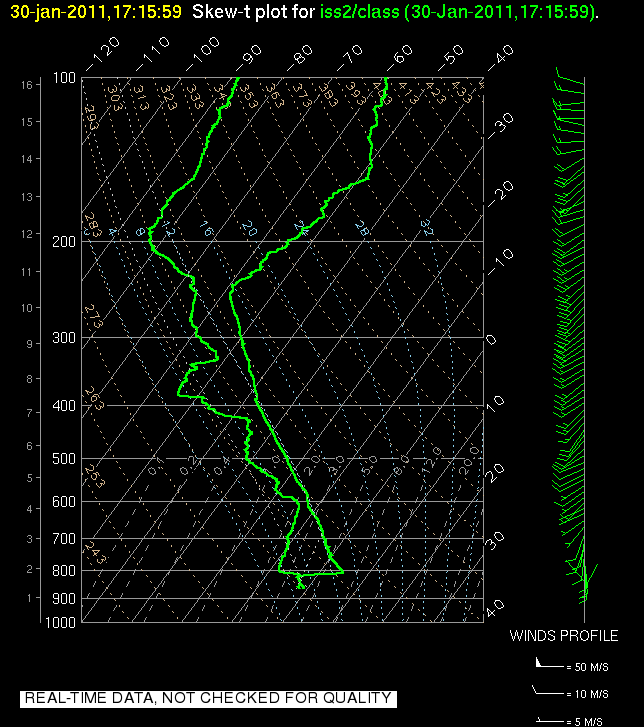
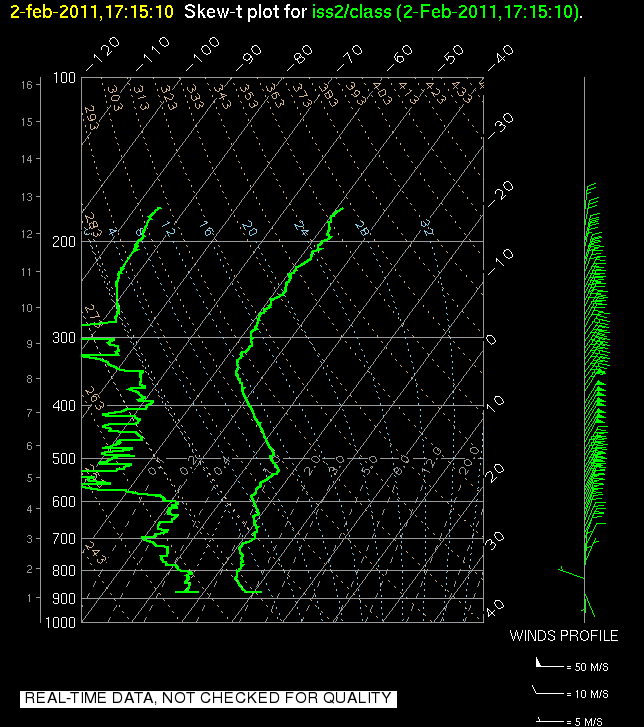
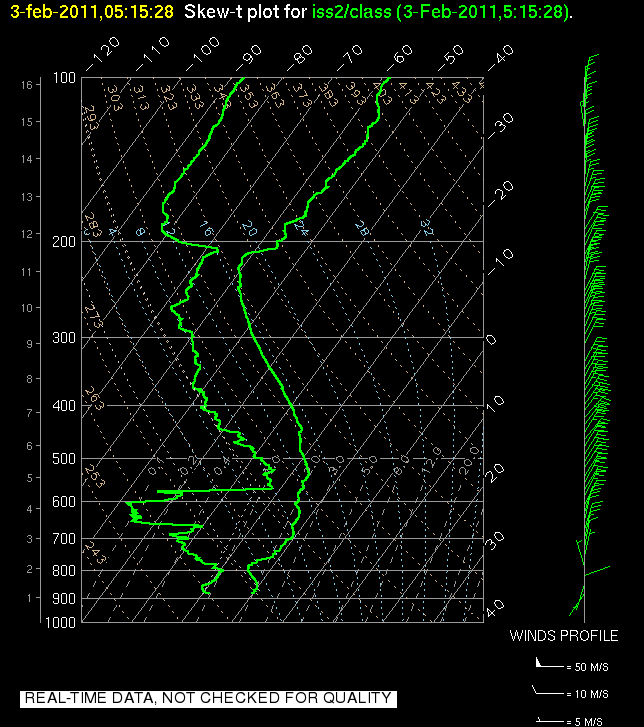
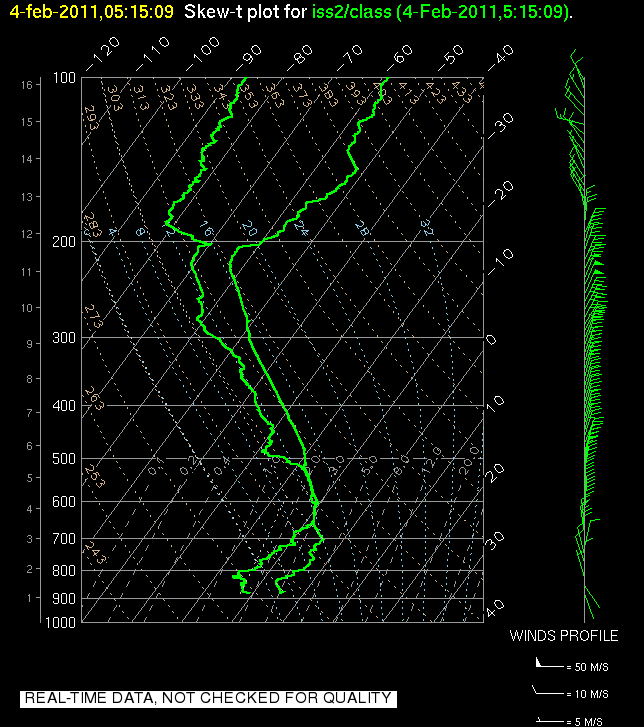
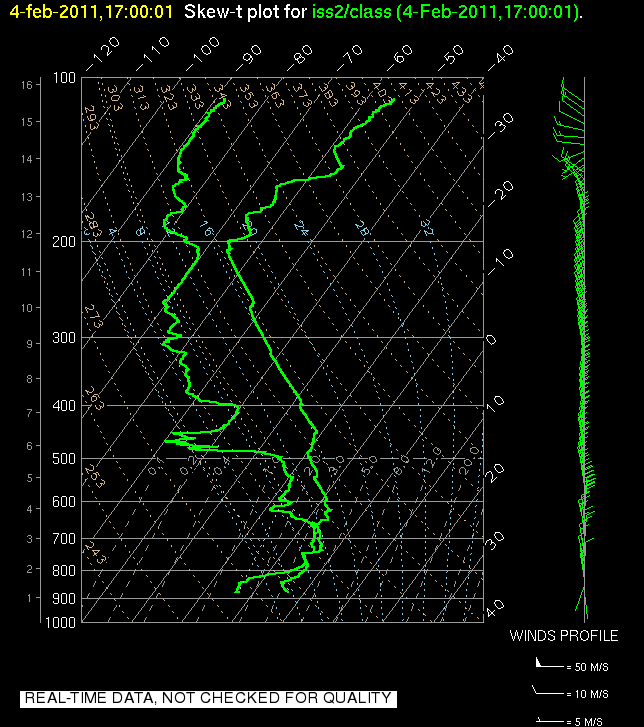
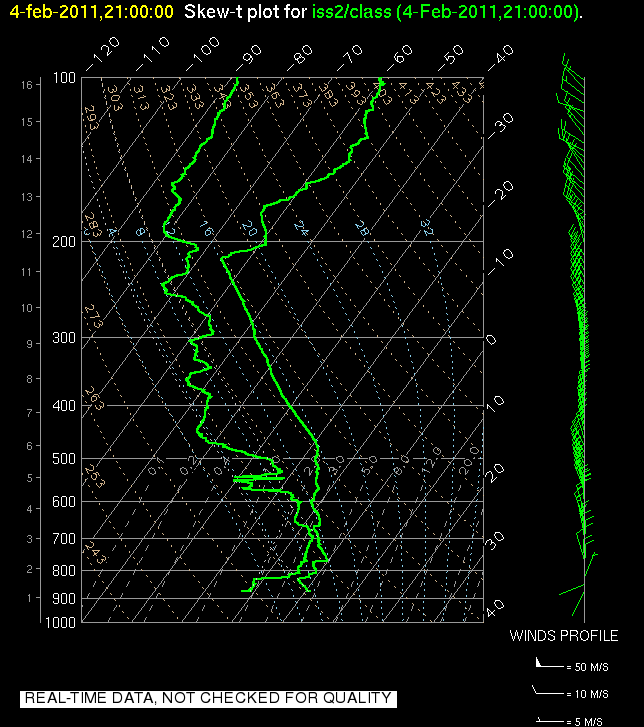
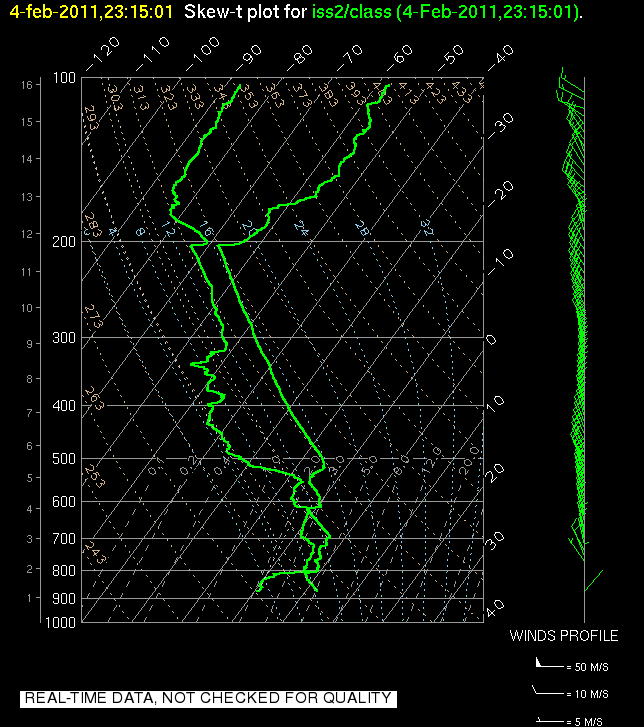
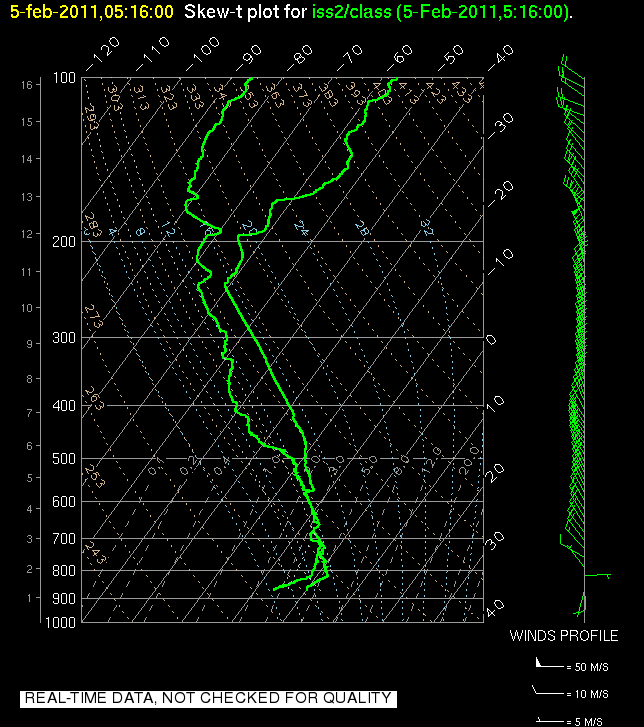
a standard Skew-T plot (click on the "SkewT" link) and
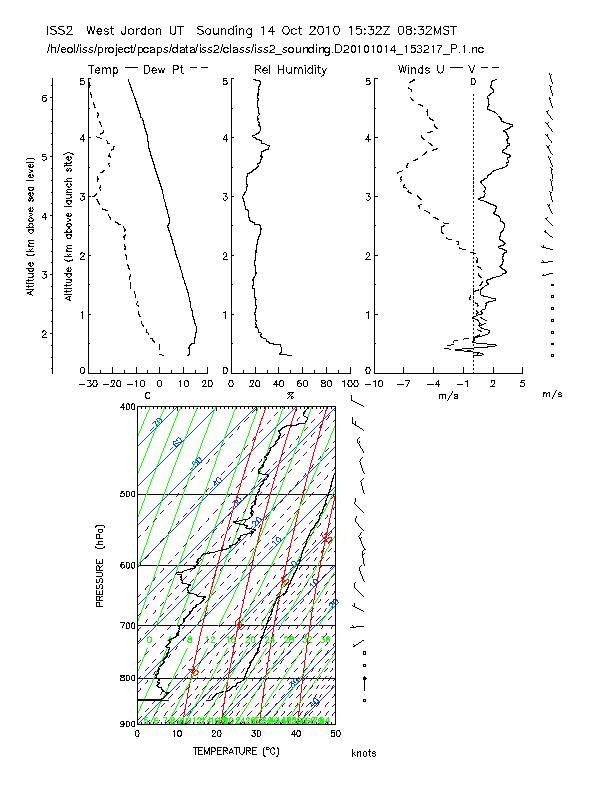
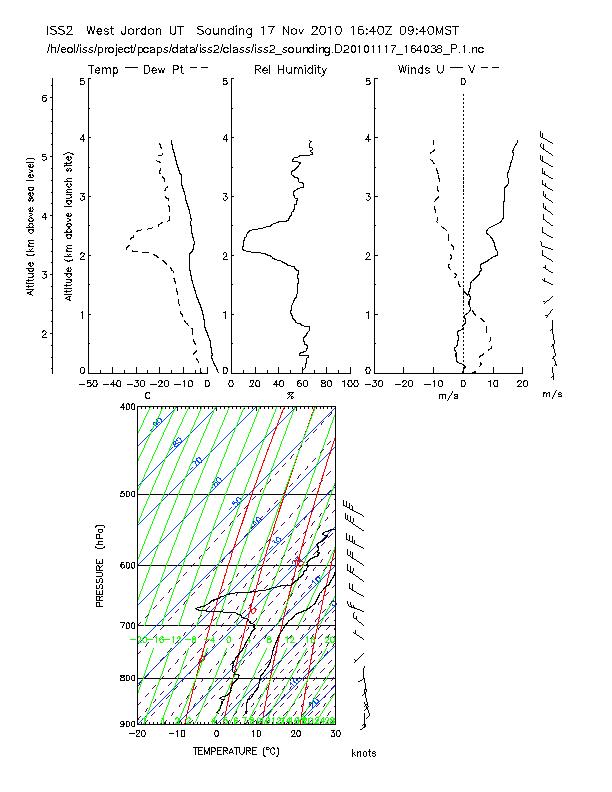
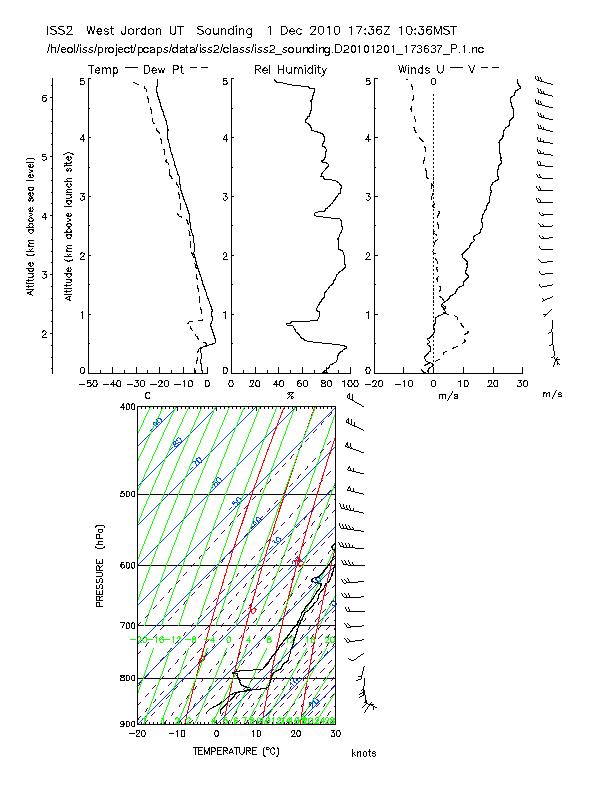
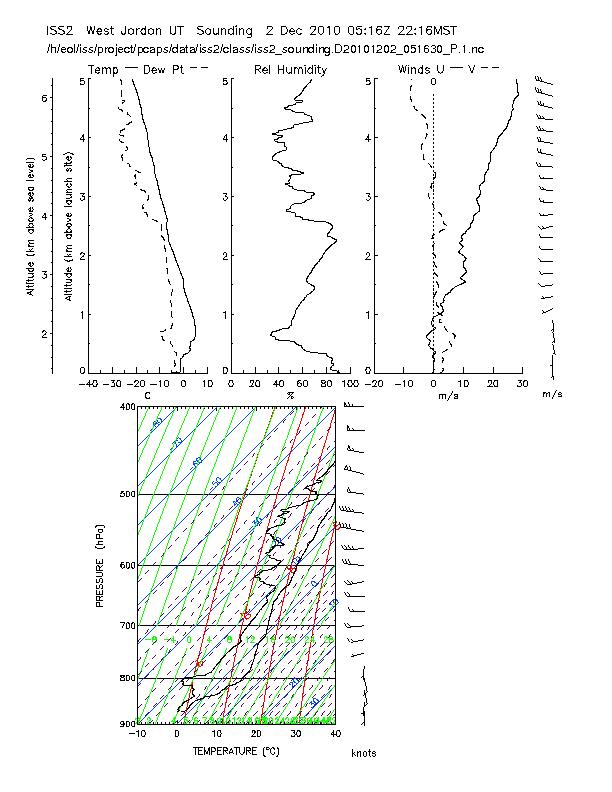
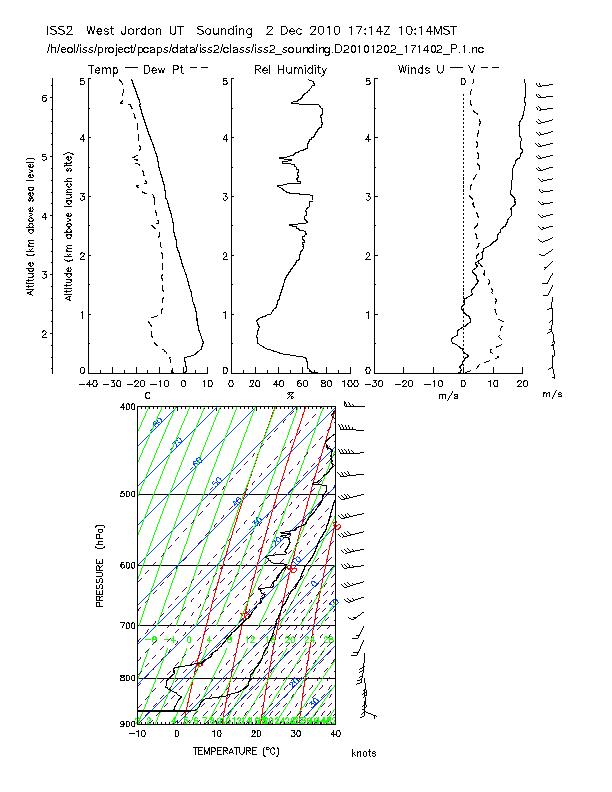
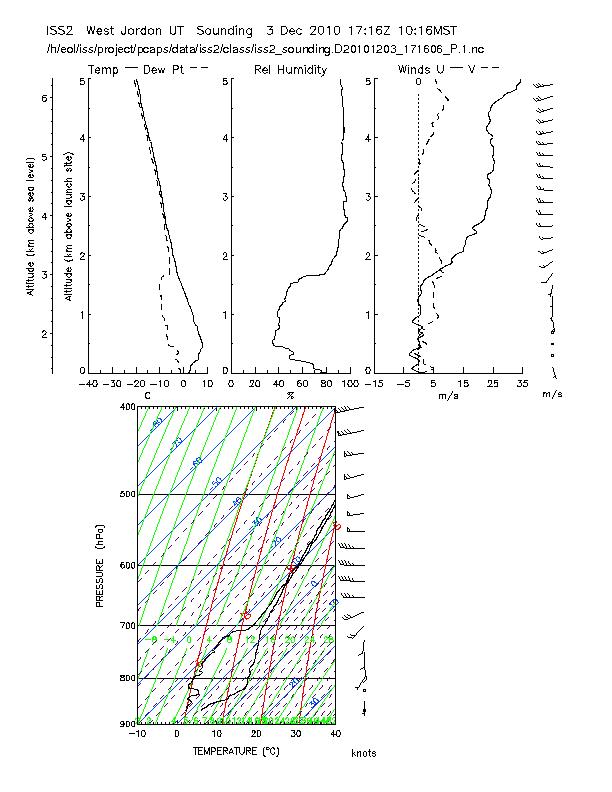
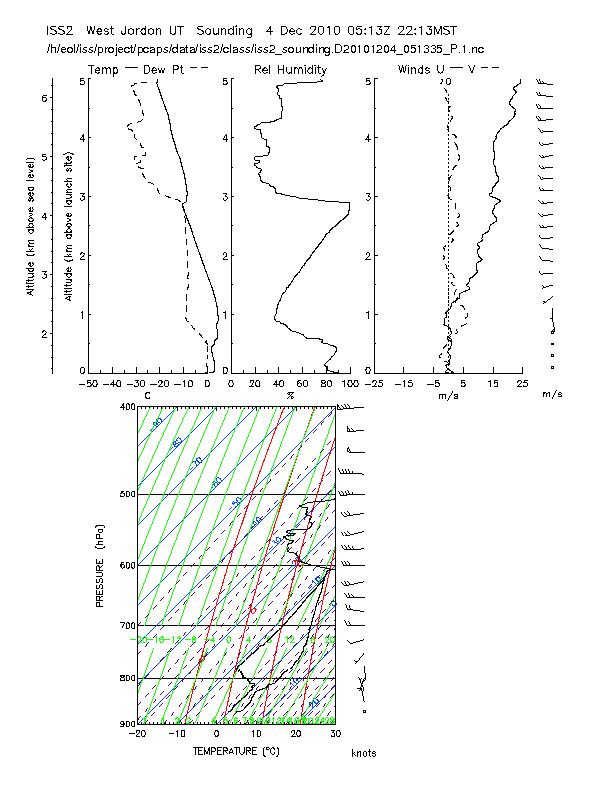
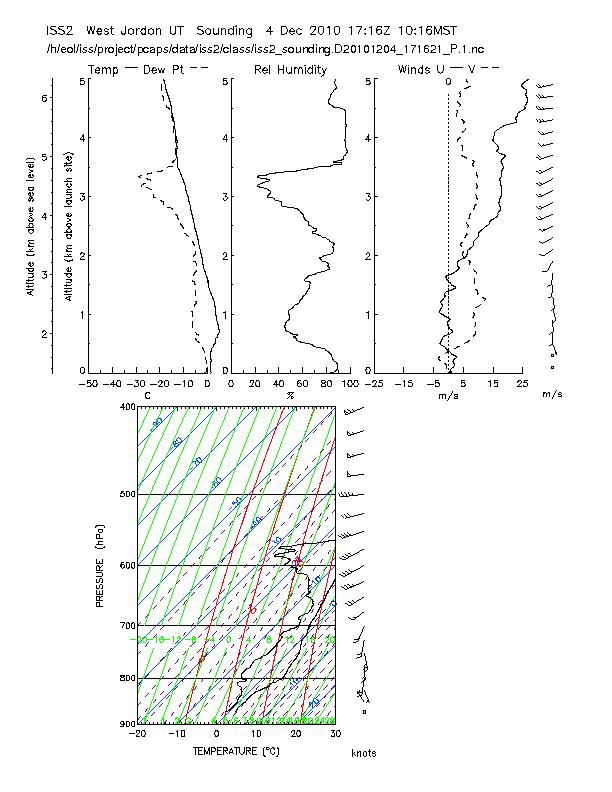
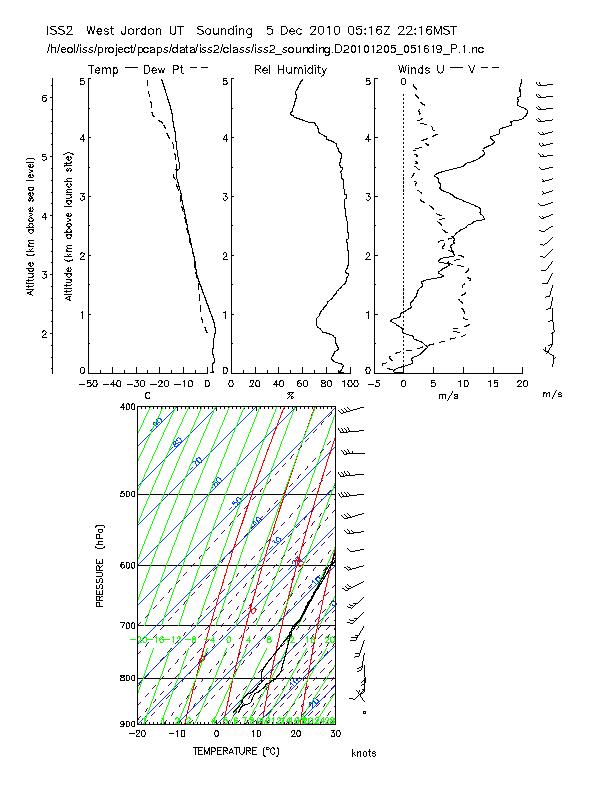
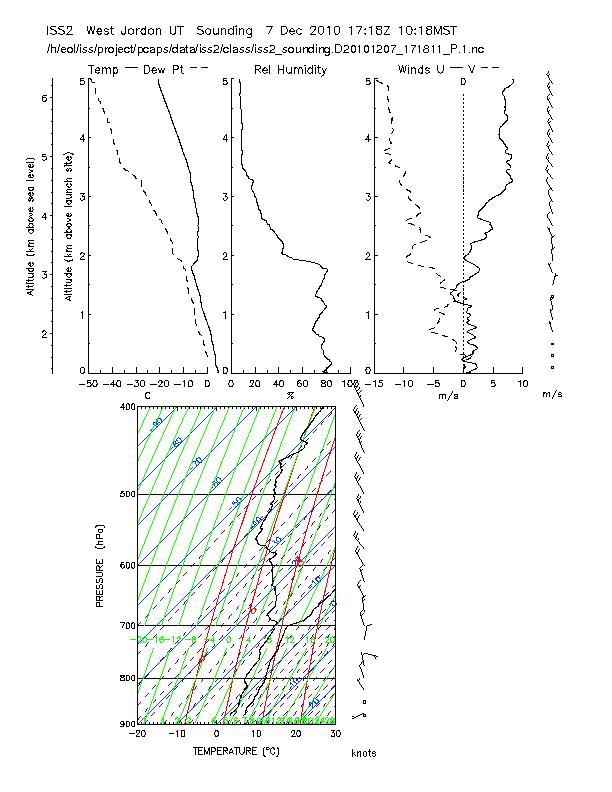
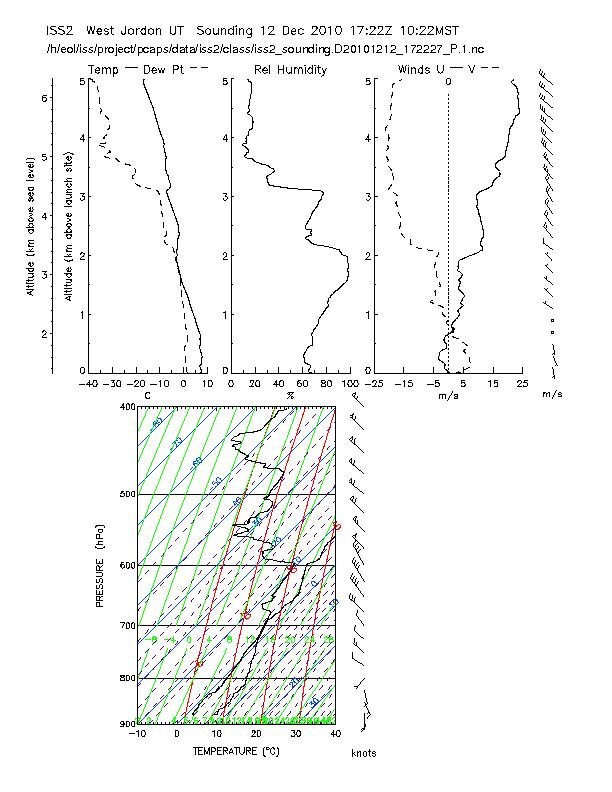
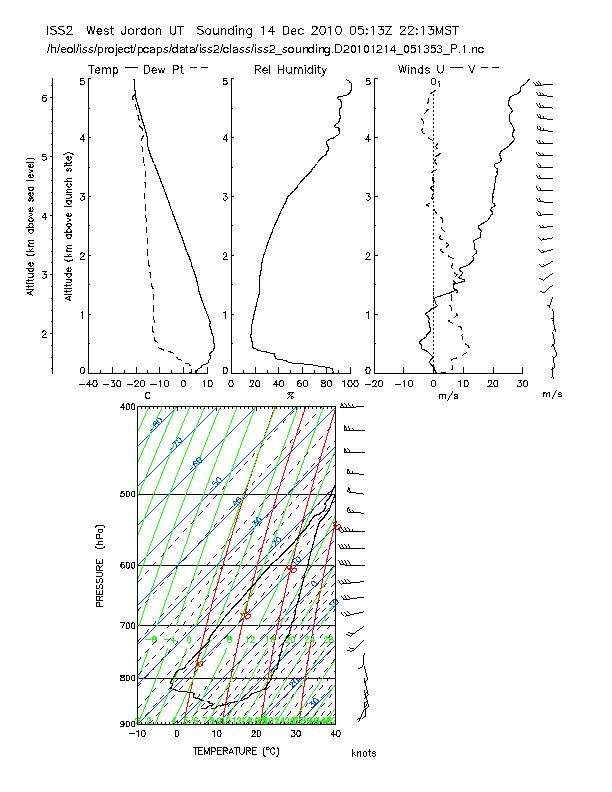
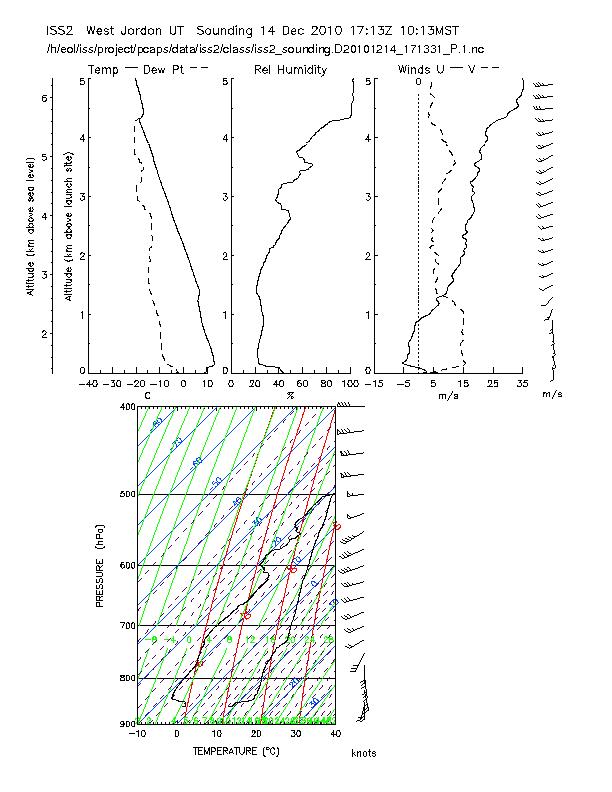
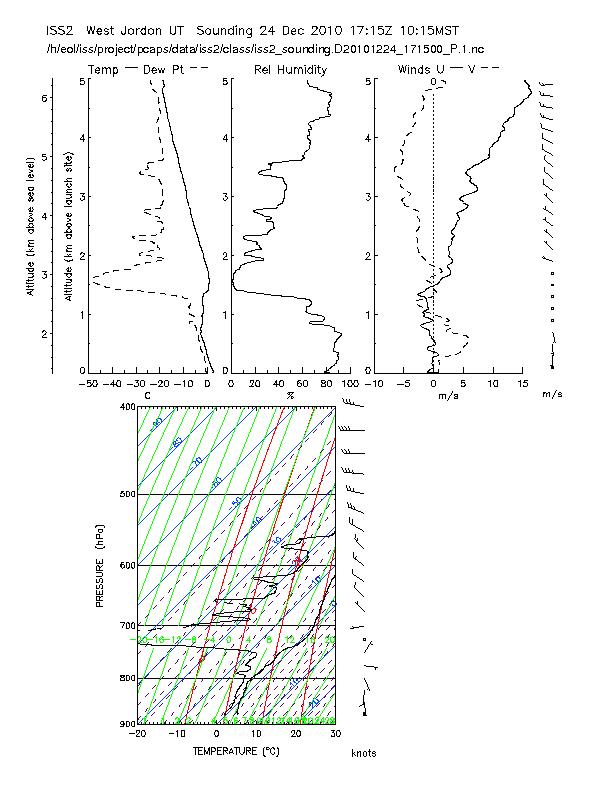
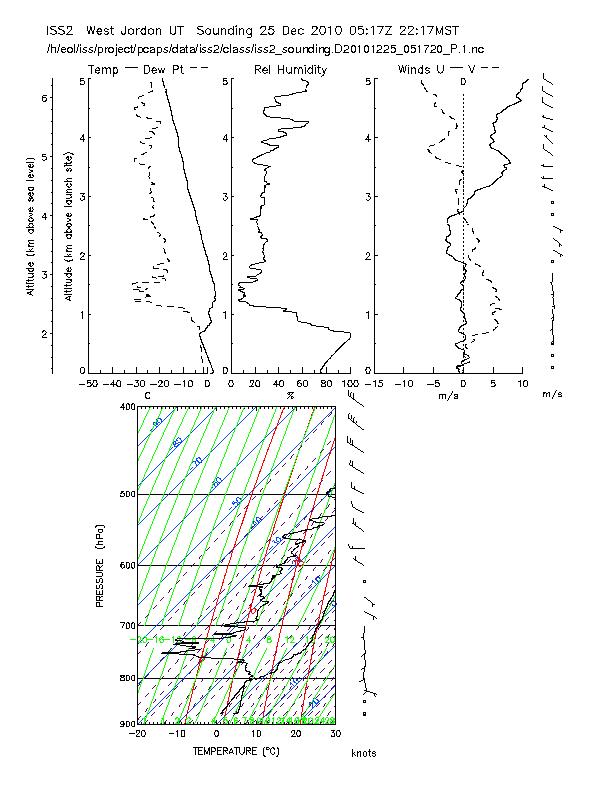
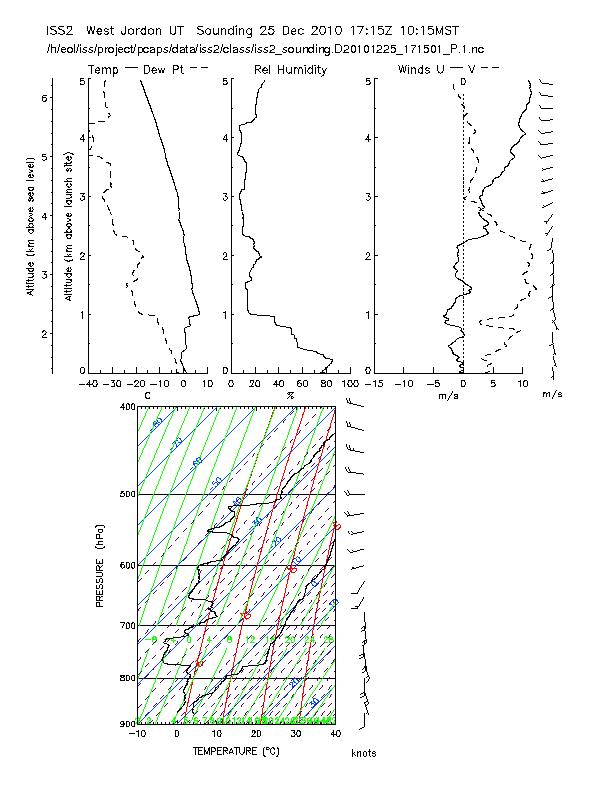
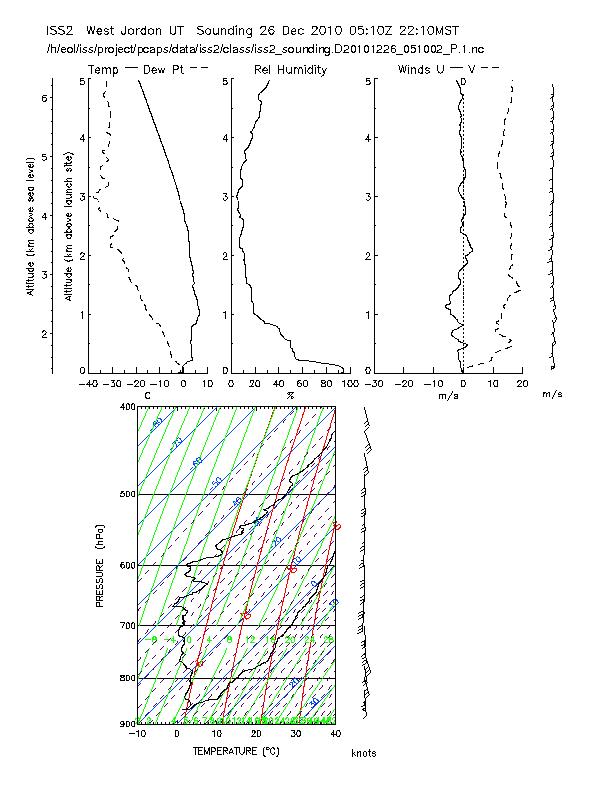
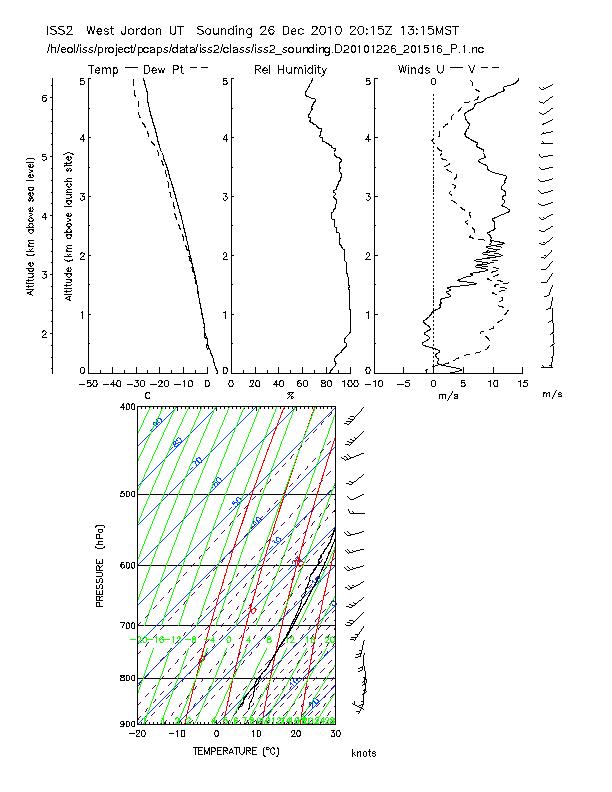
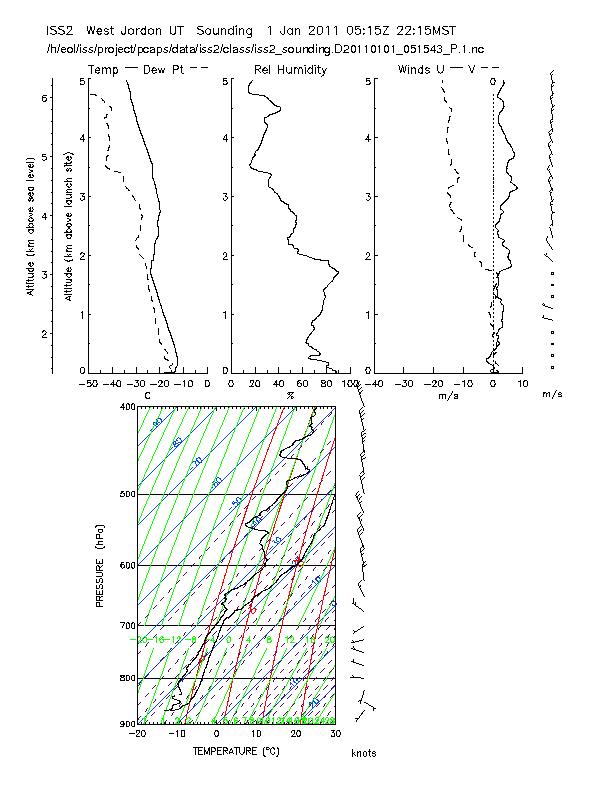
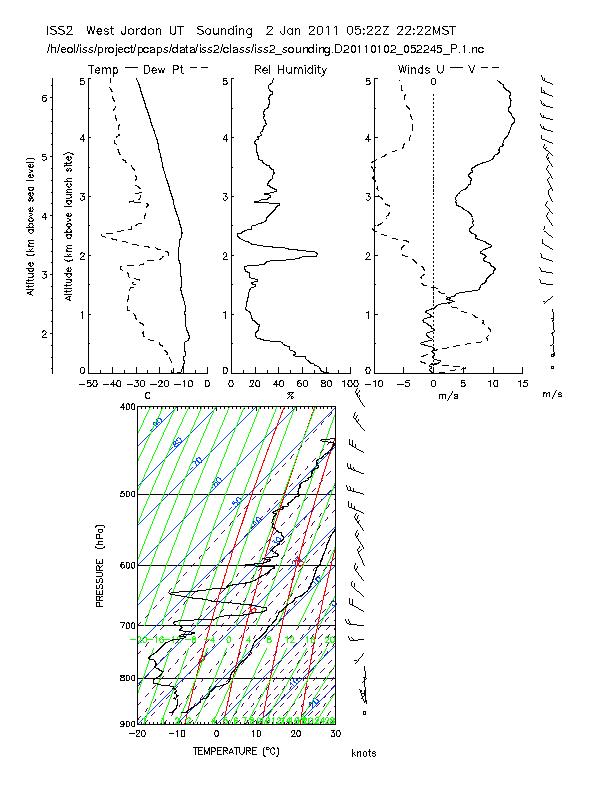
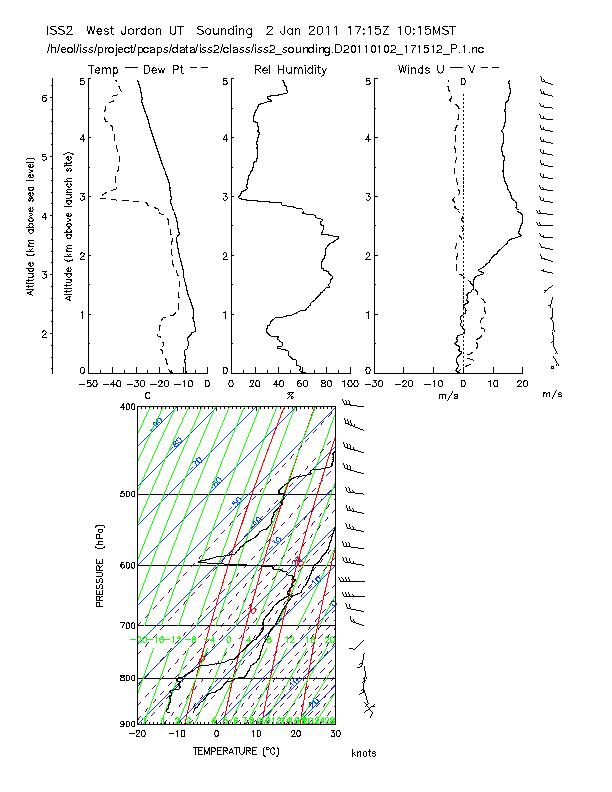
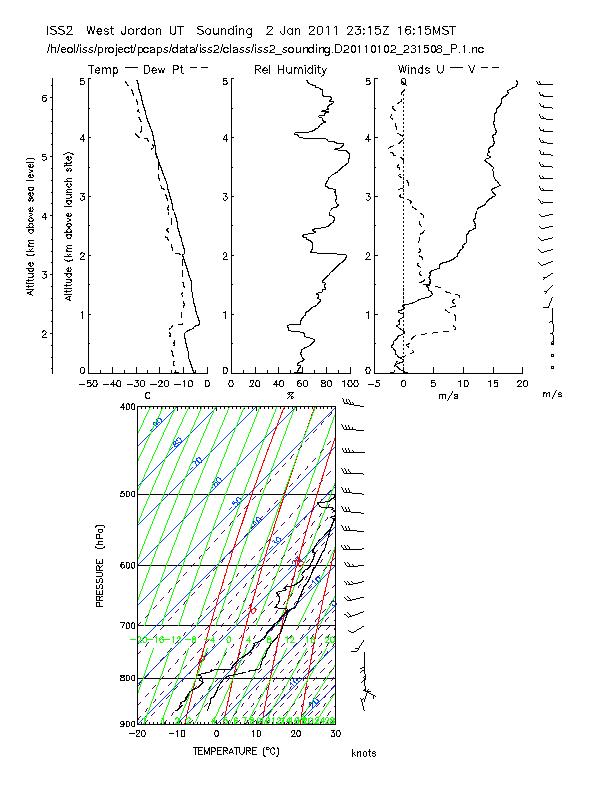
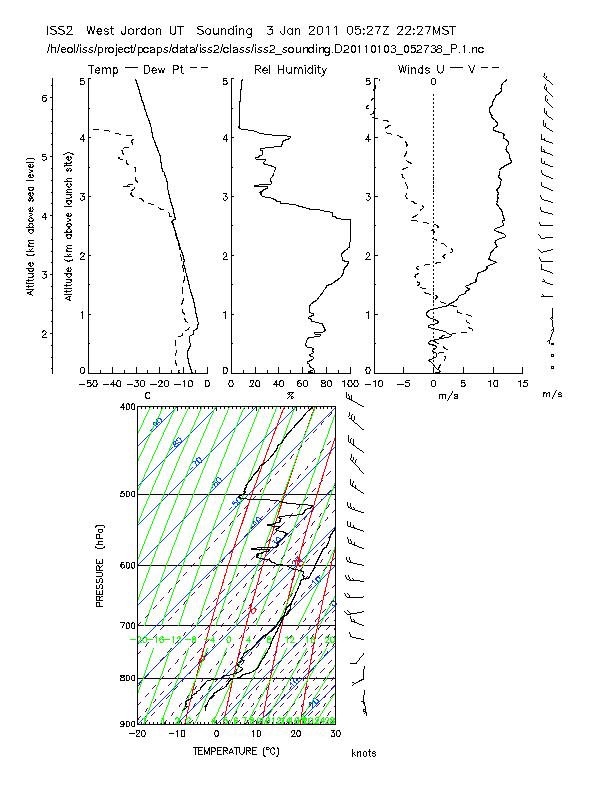
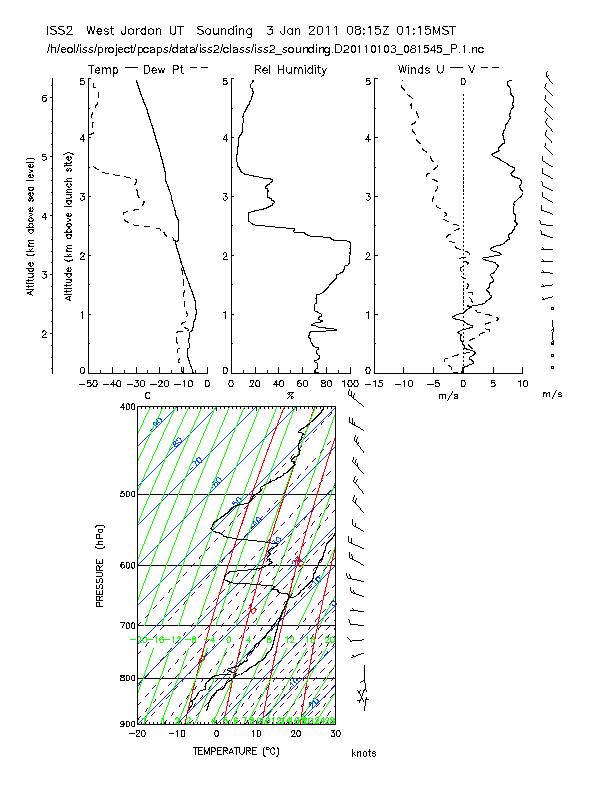
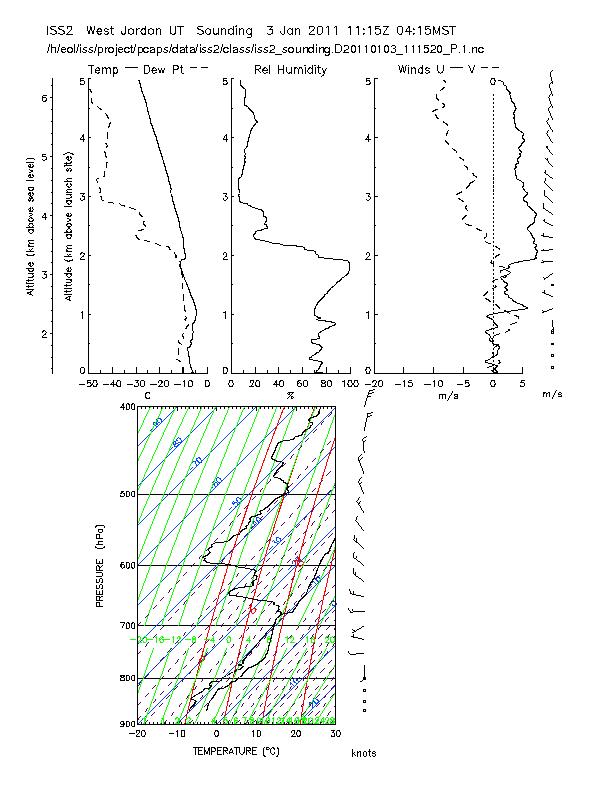
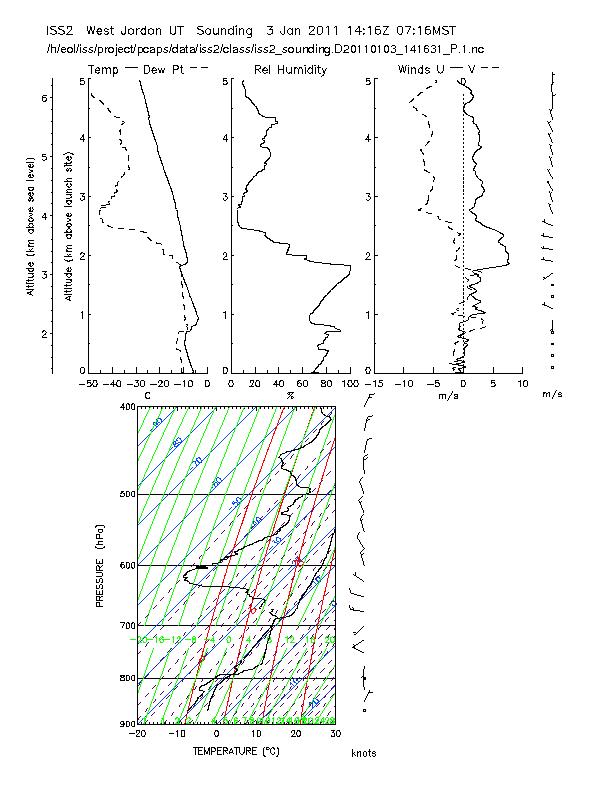
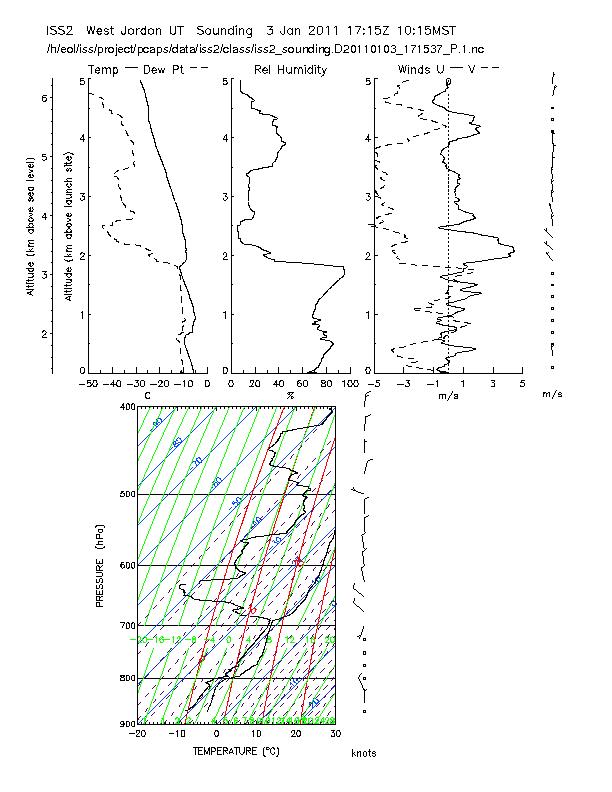
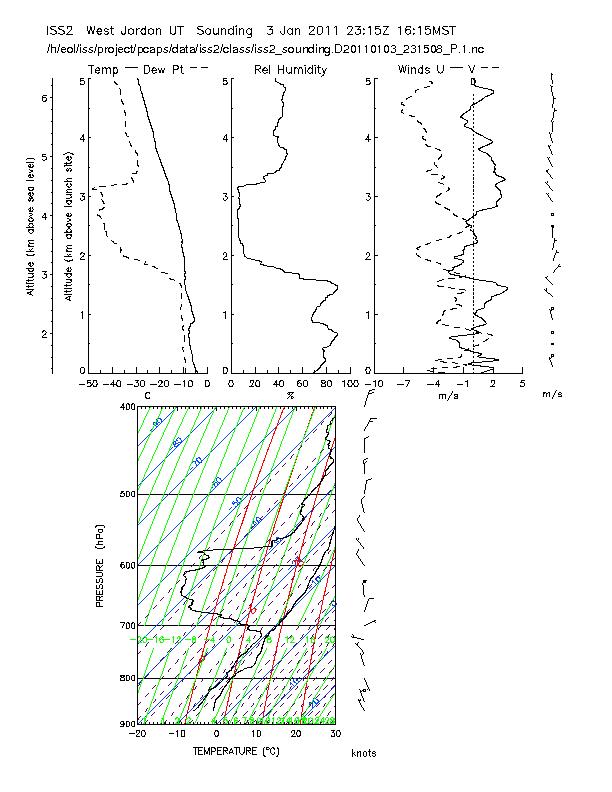
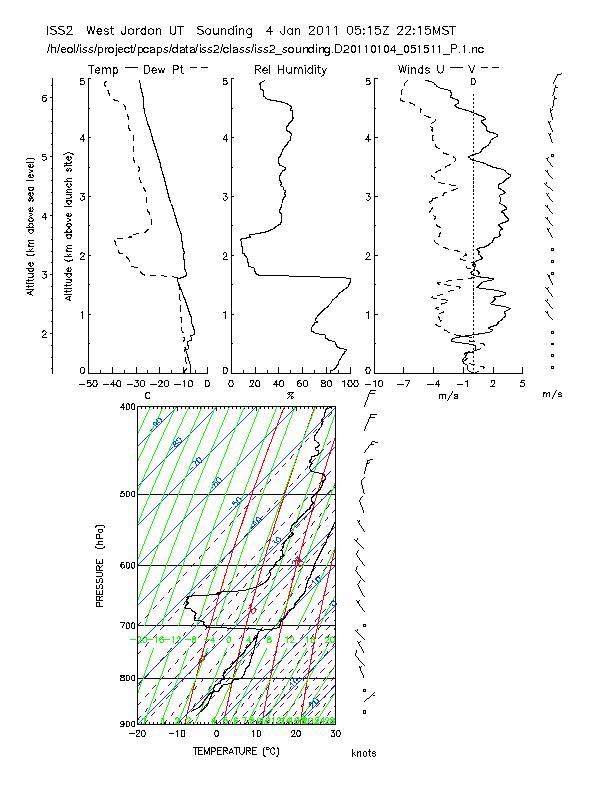
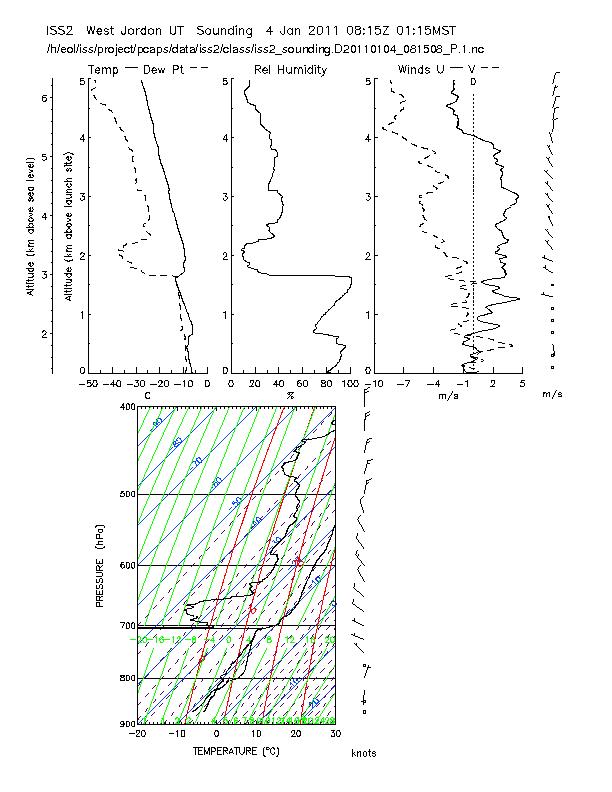
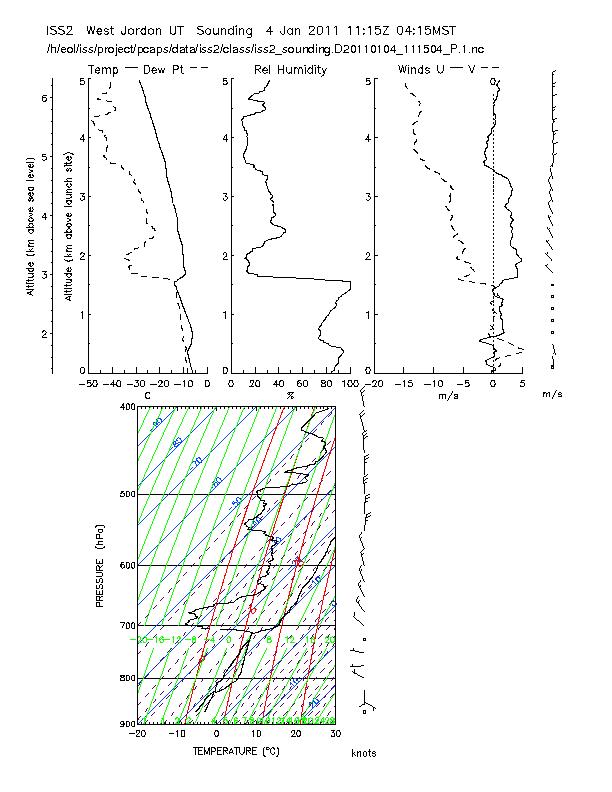
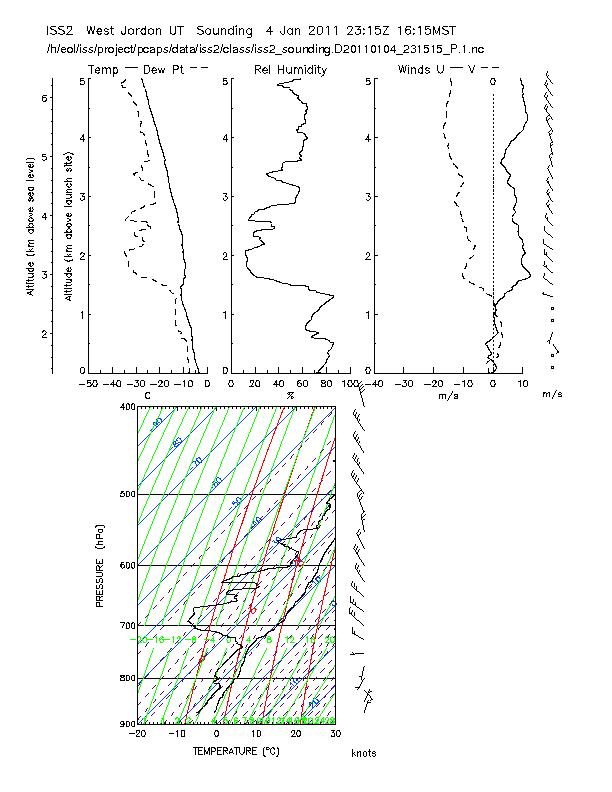
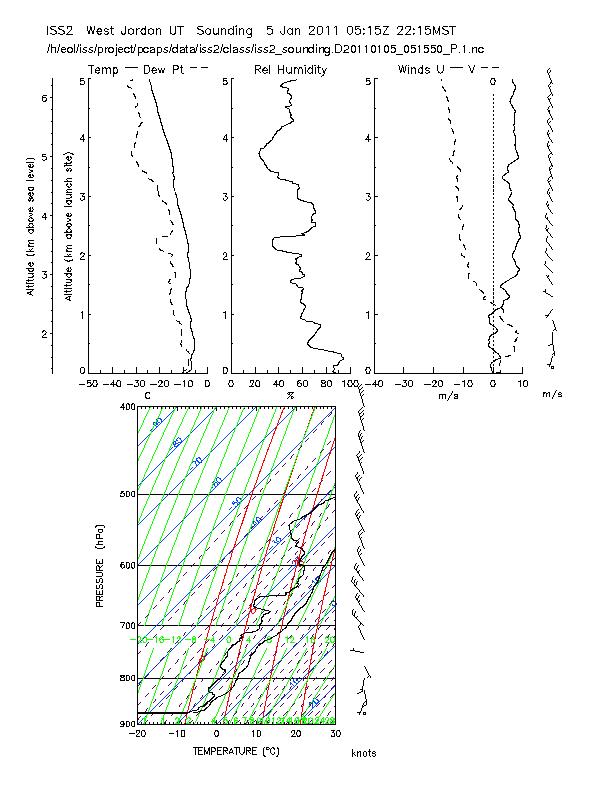
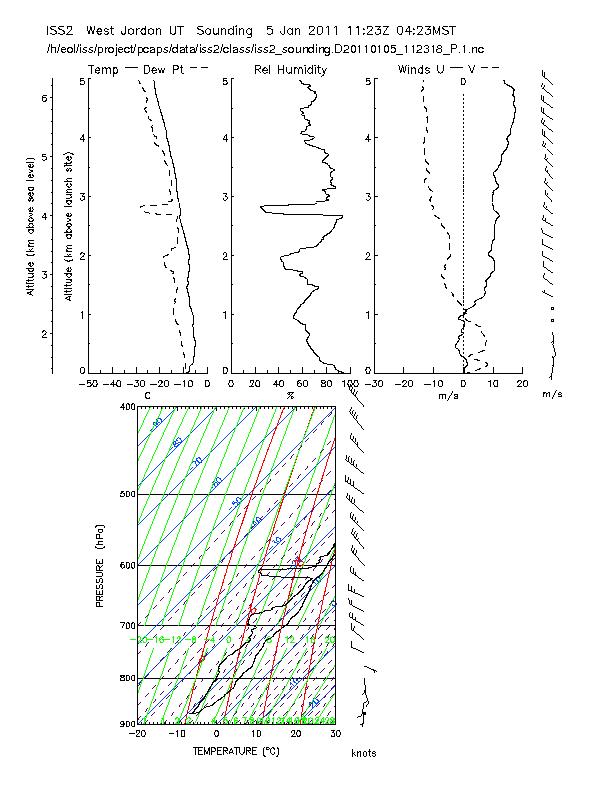
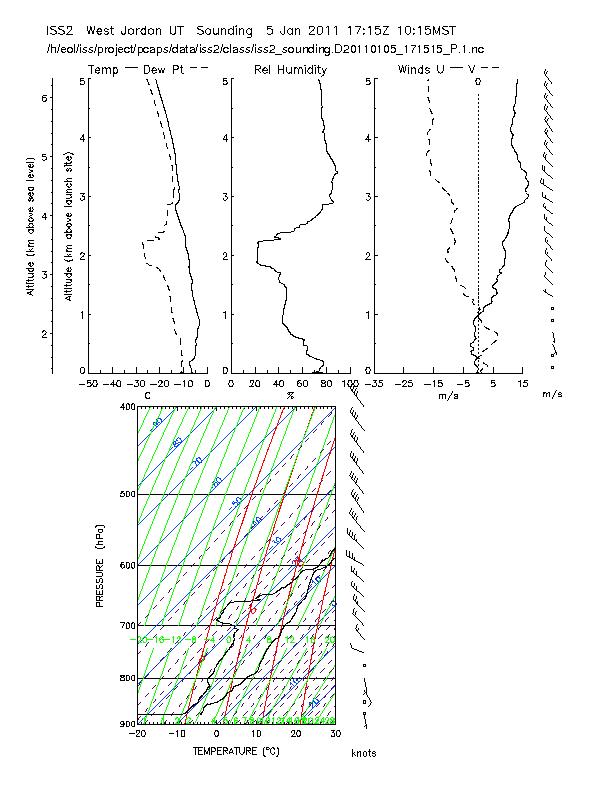
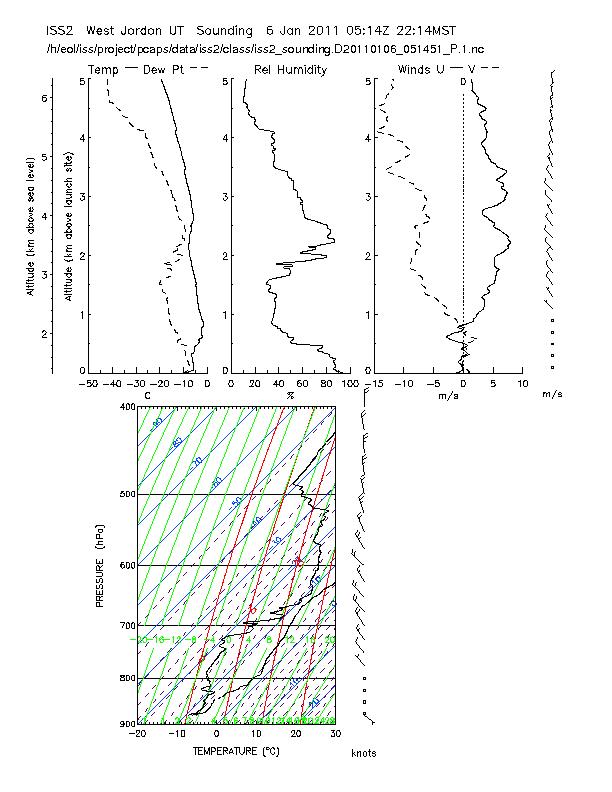
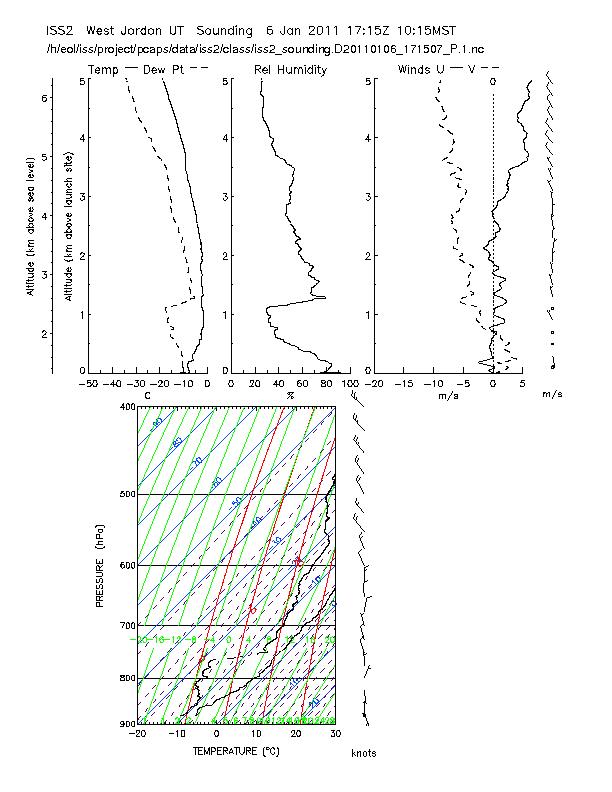
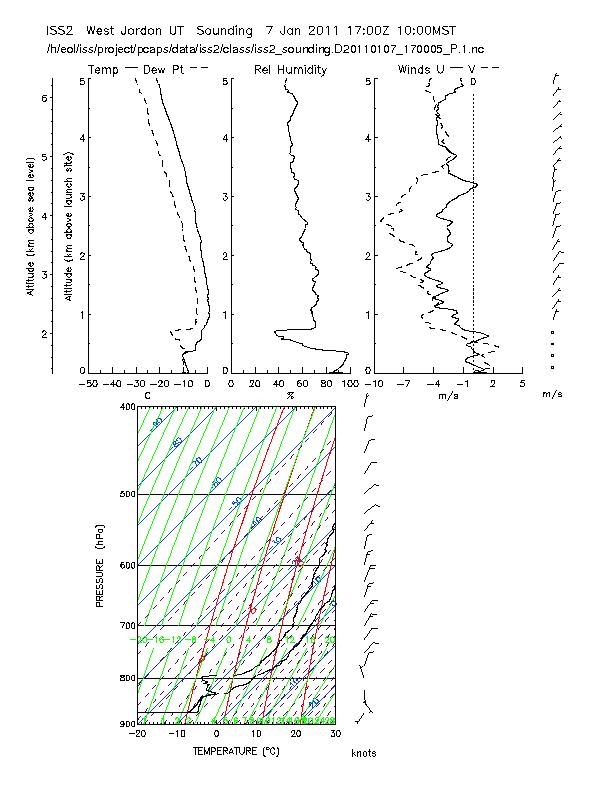
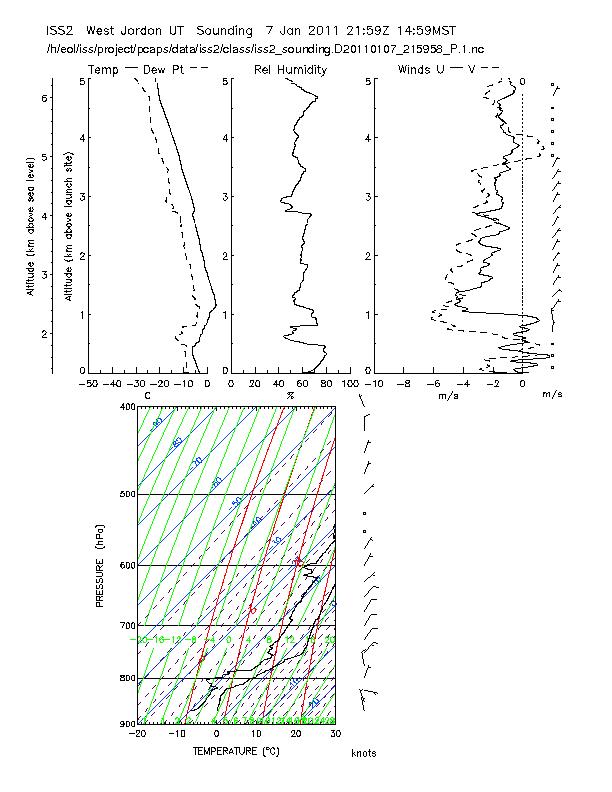
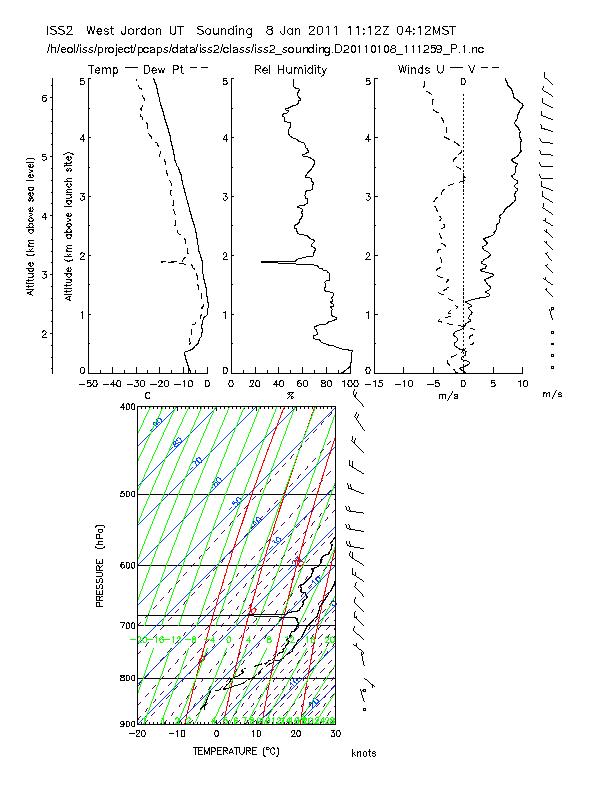
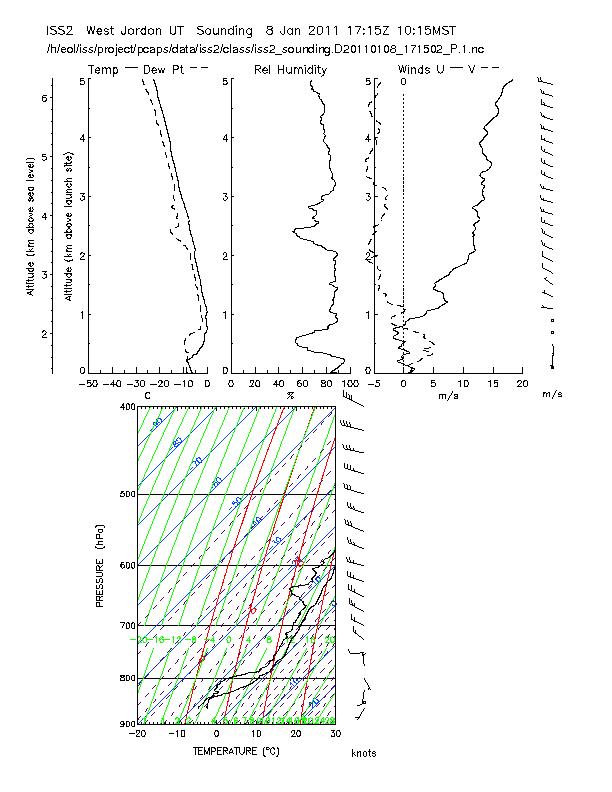
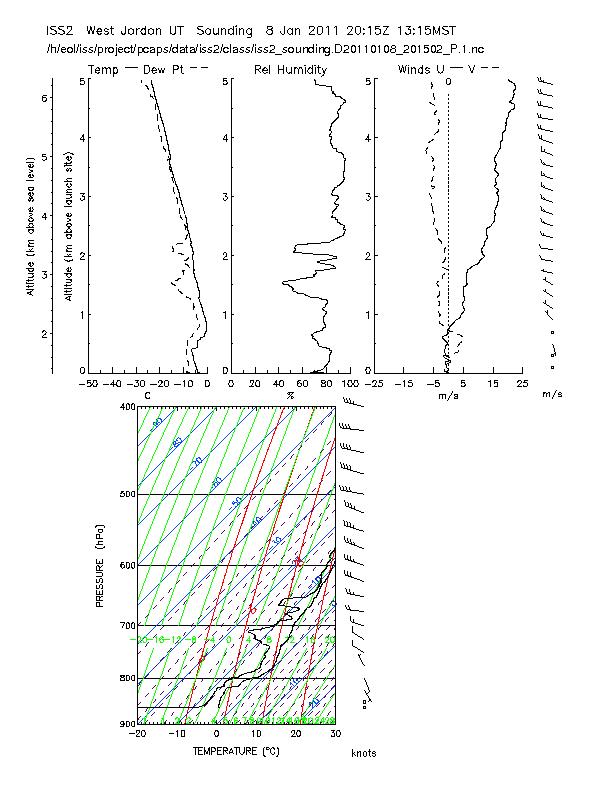
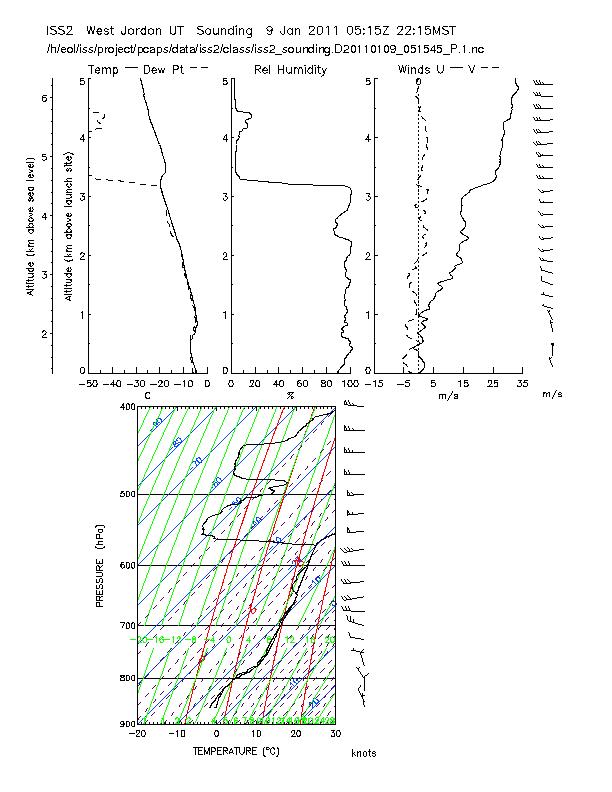
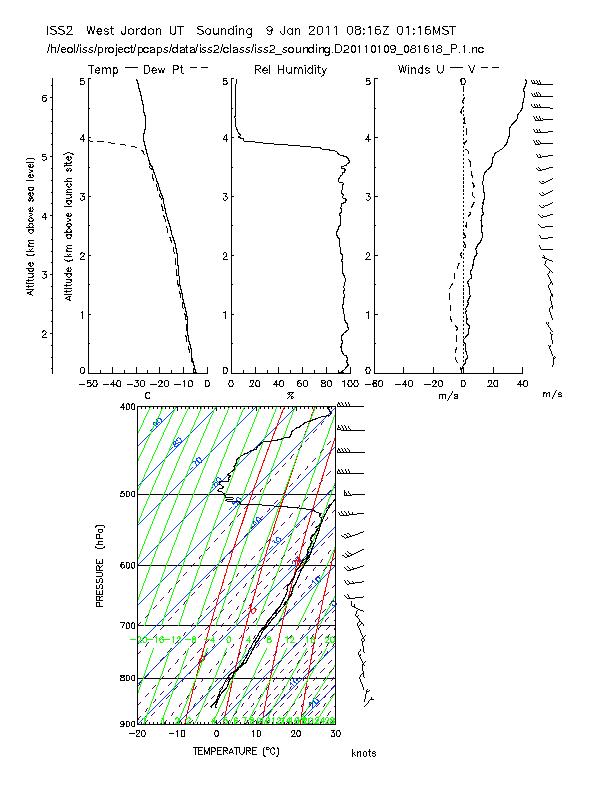
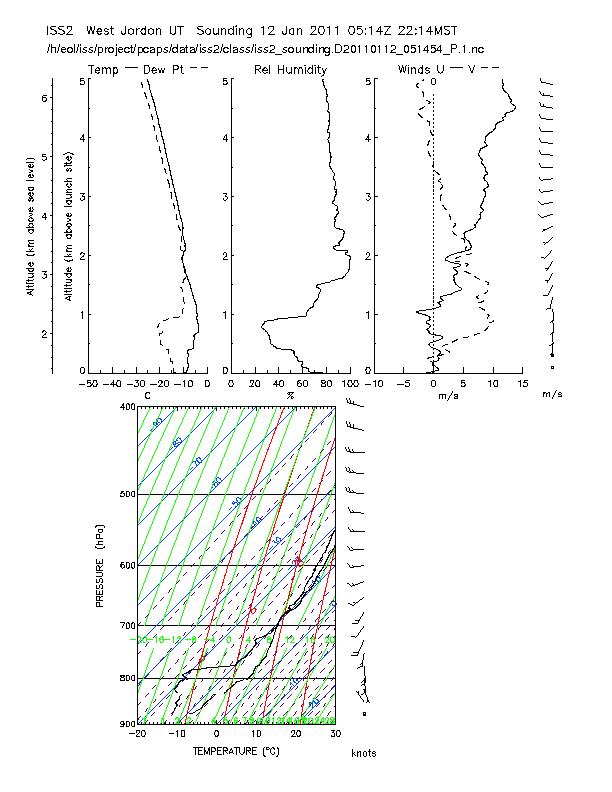
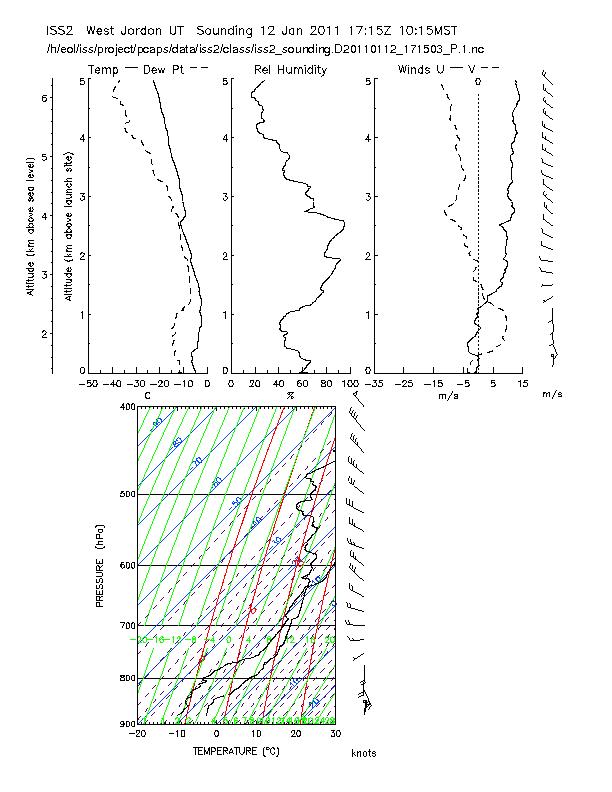
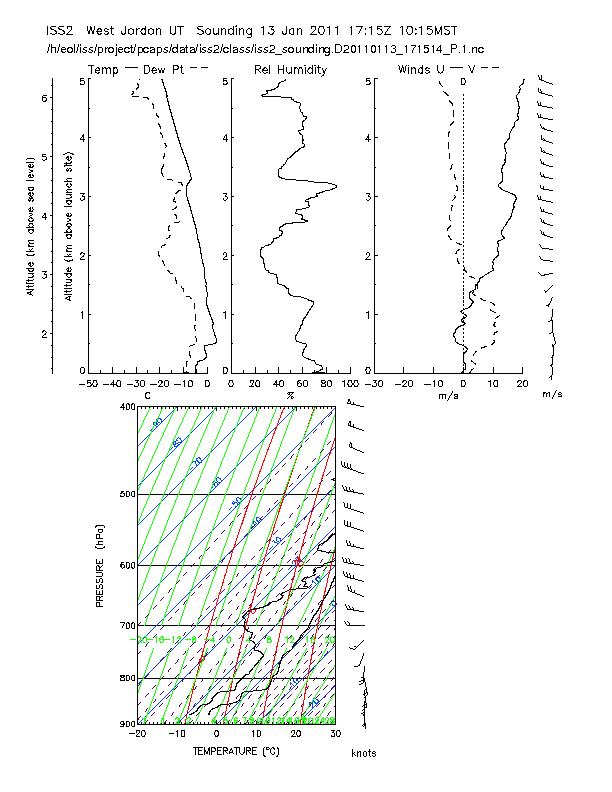
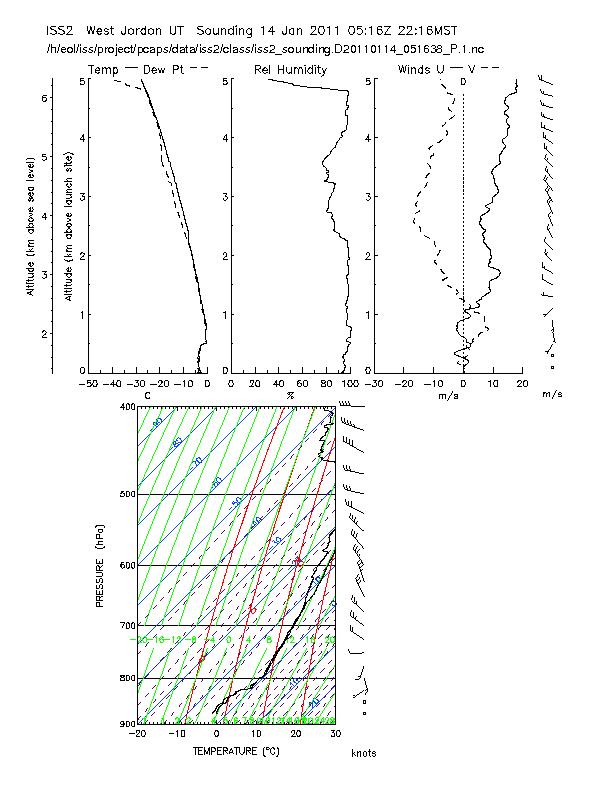
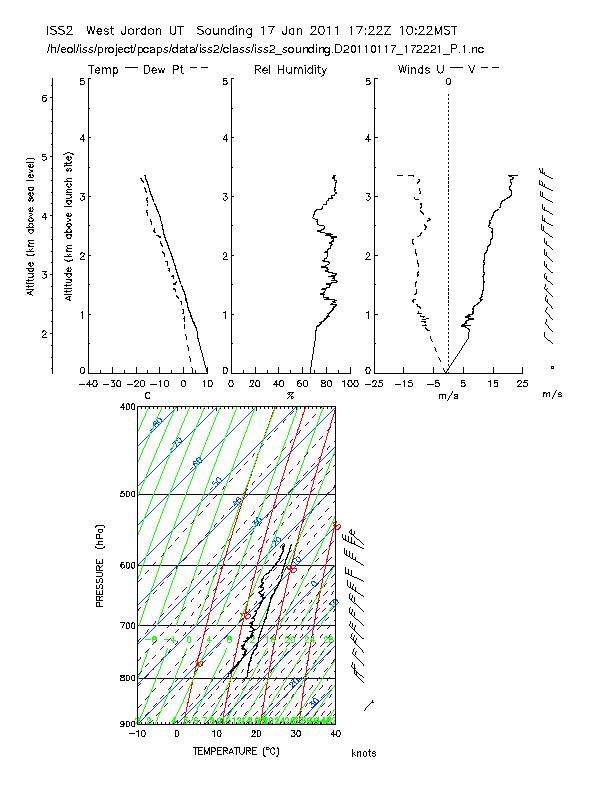
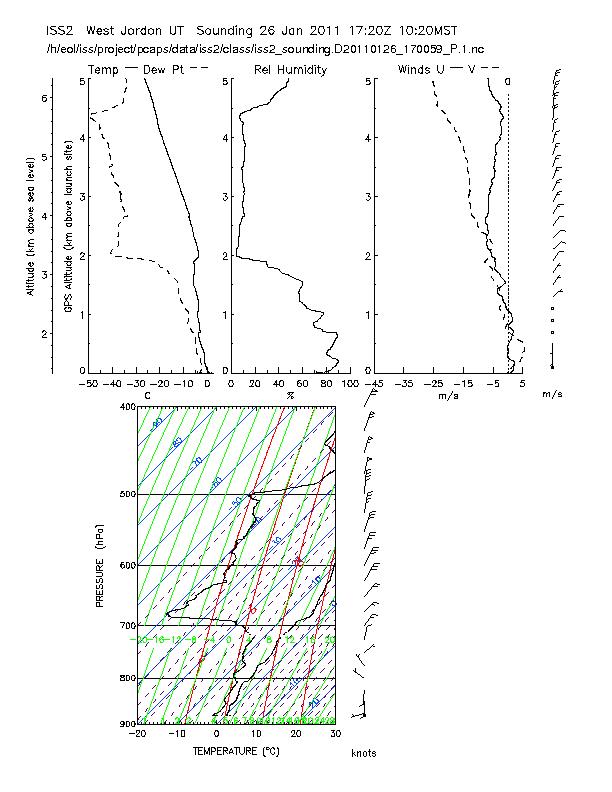
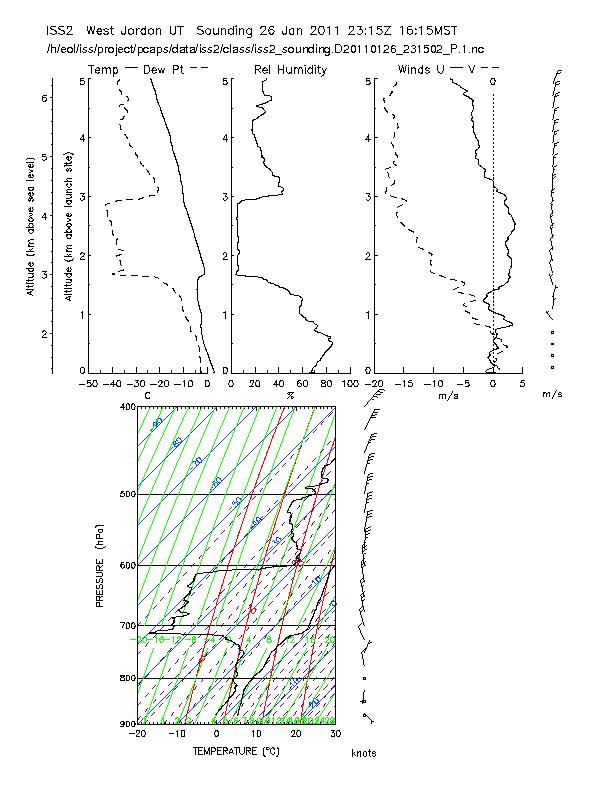
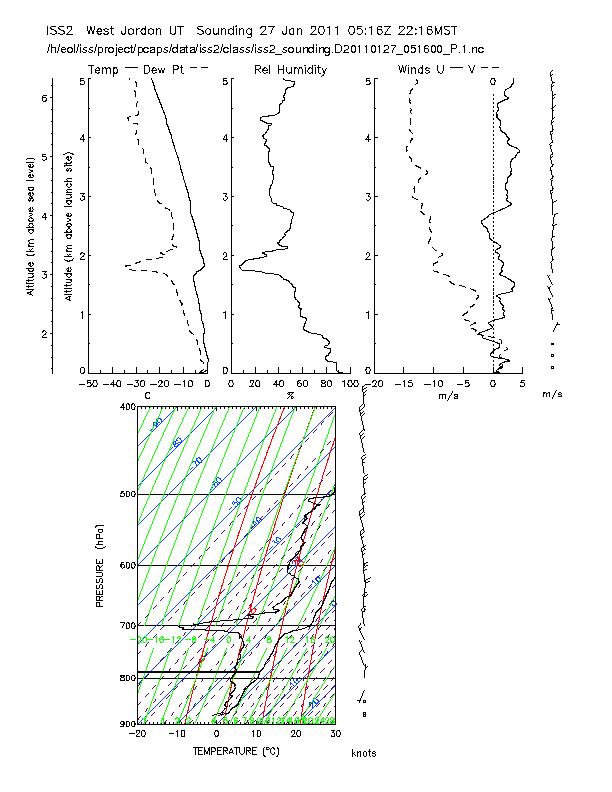
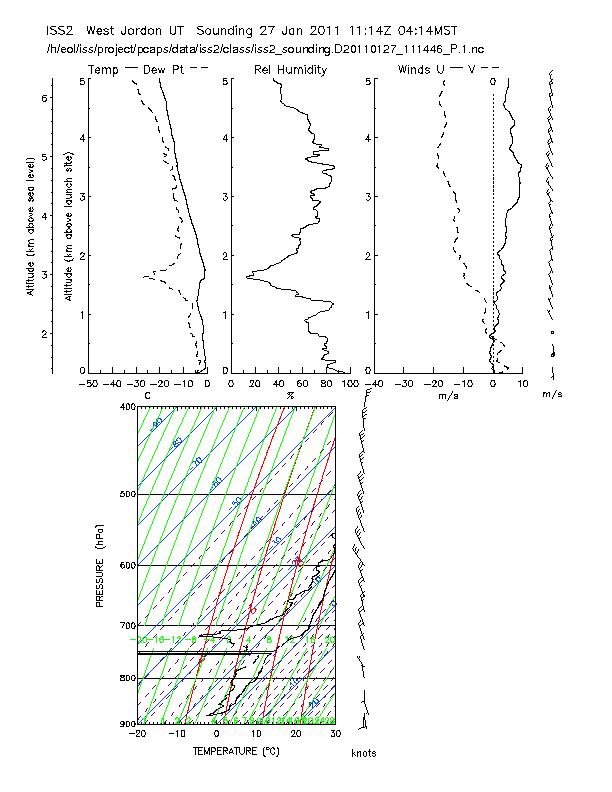
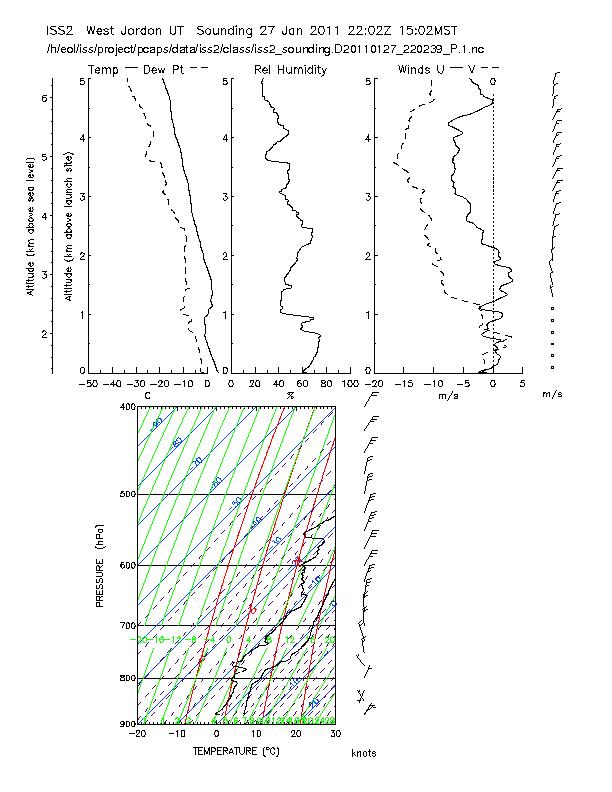
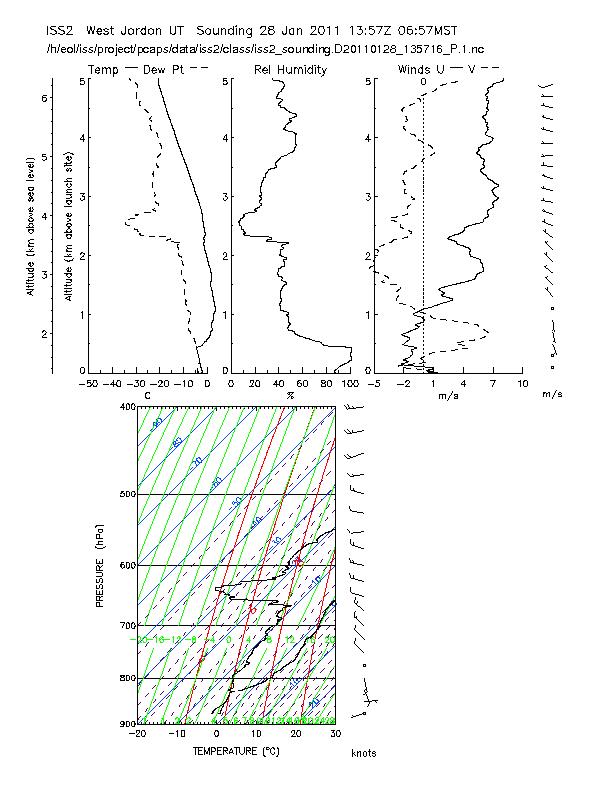
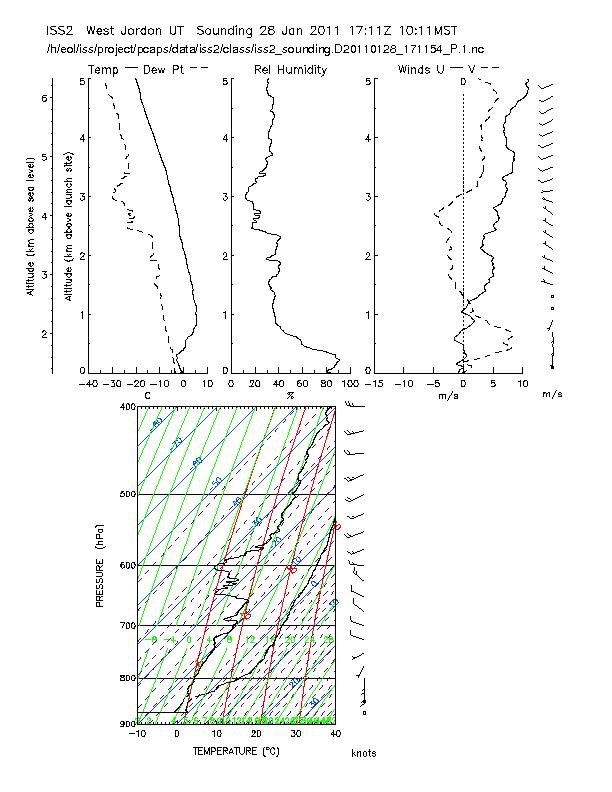
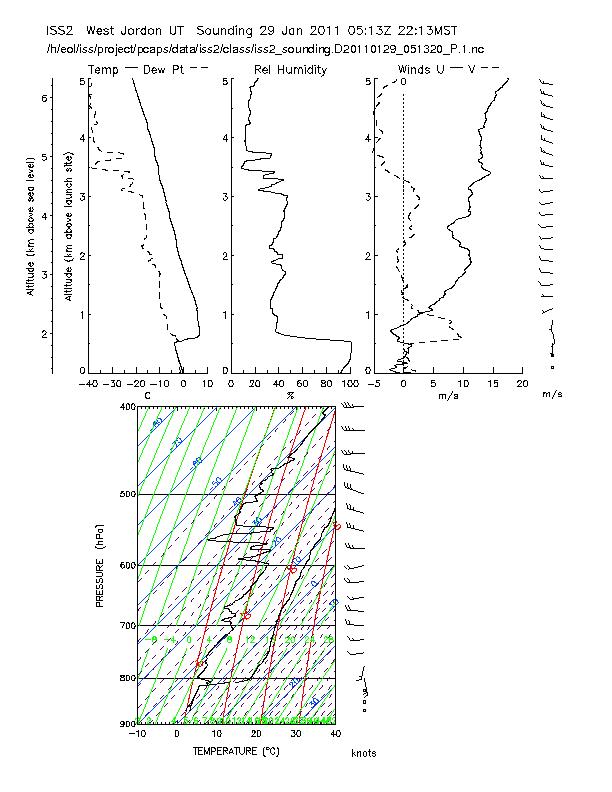
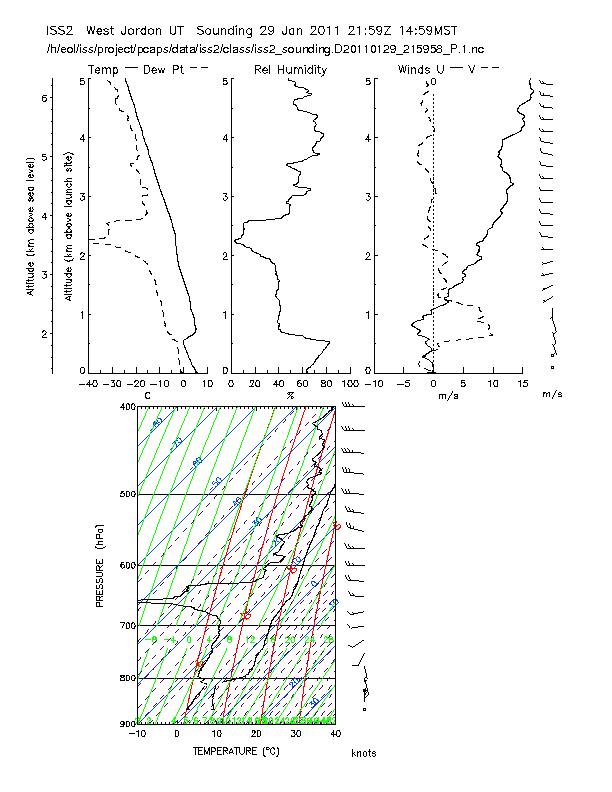
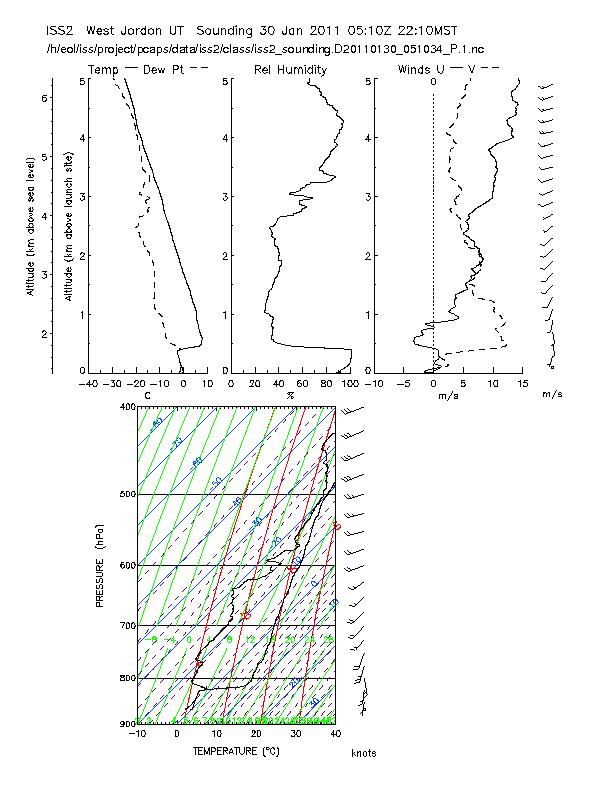
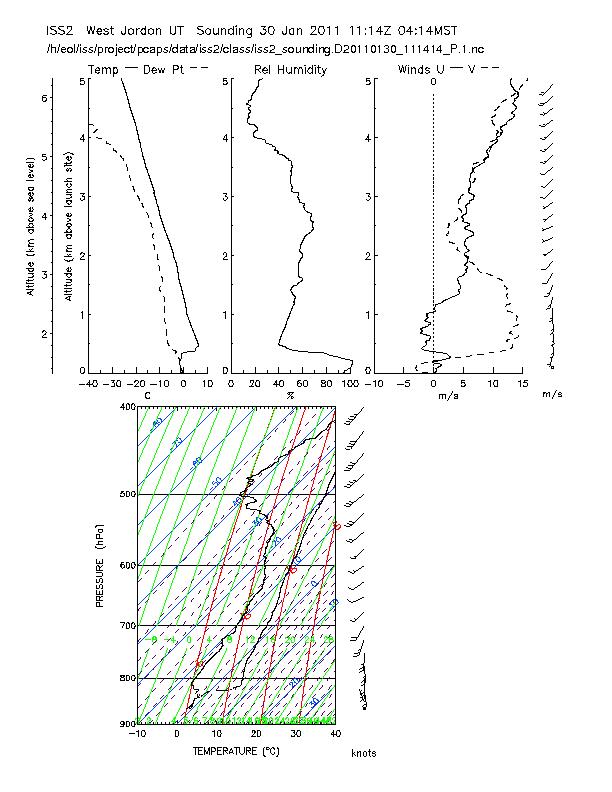
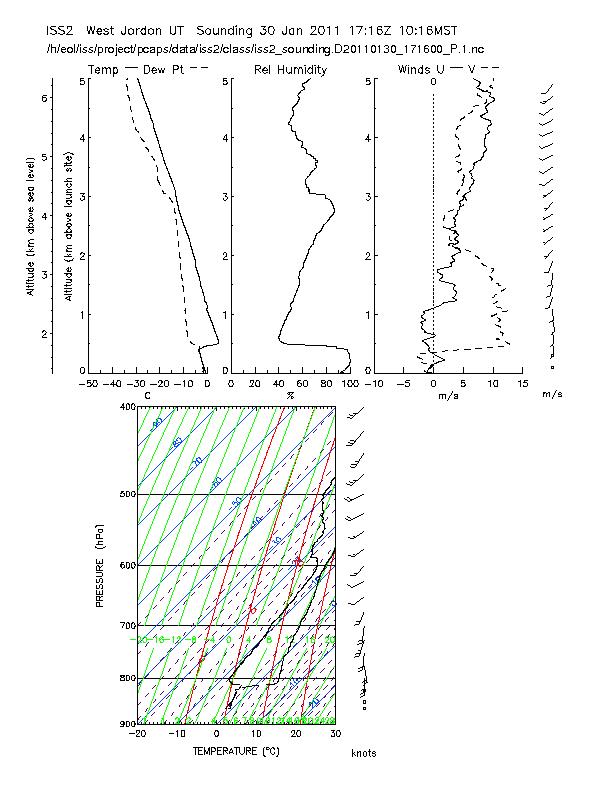
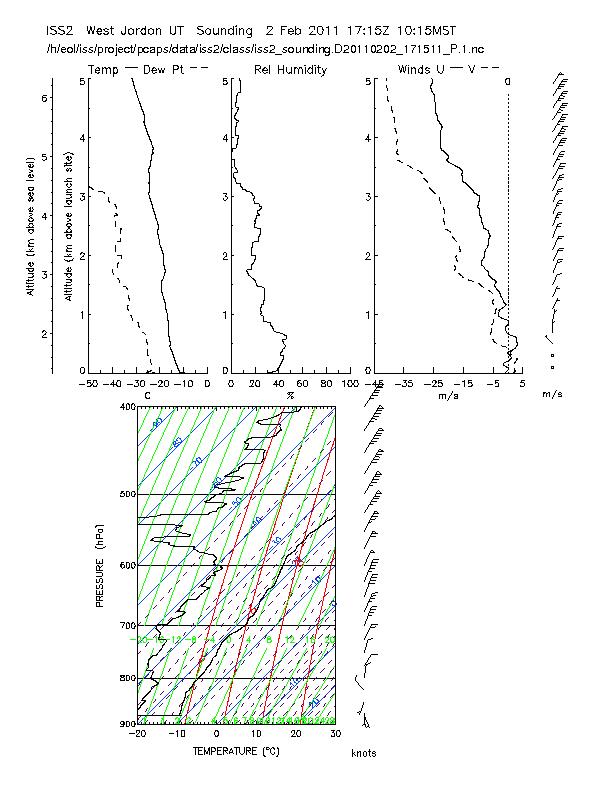
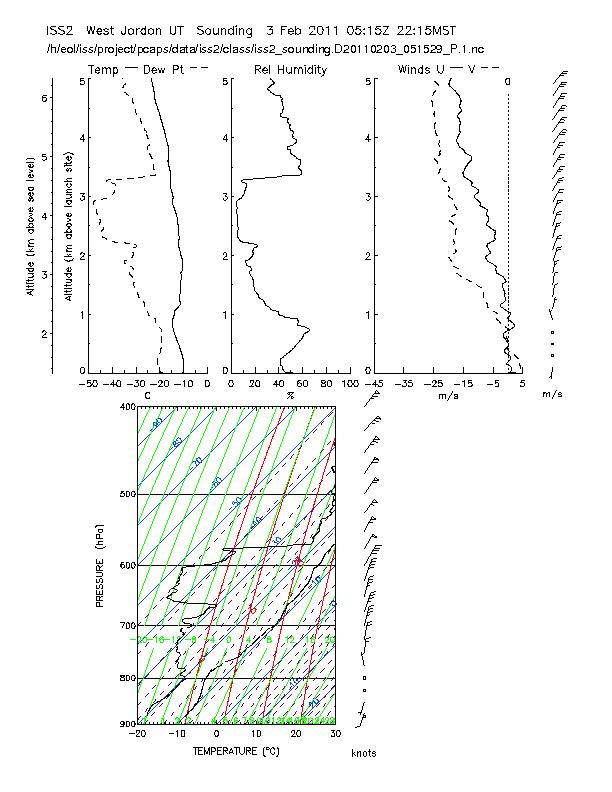
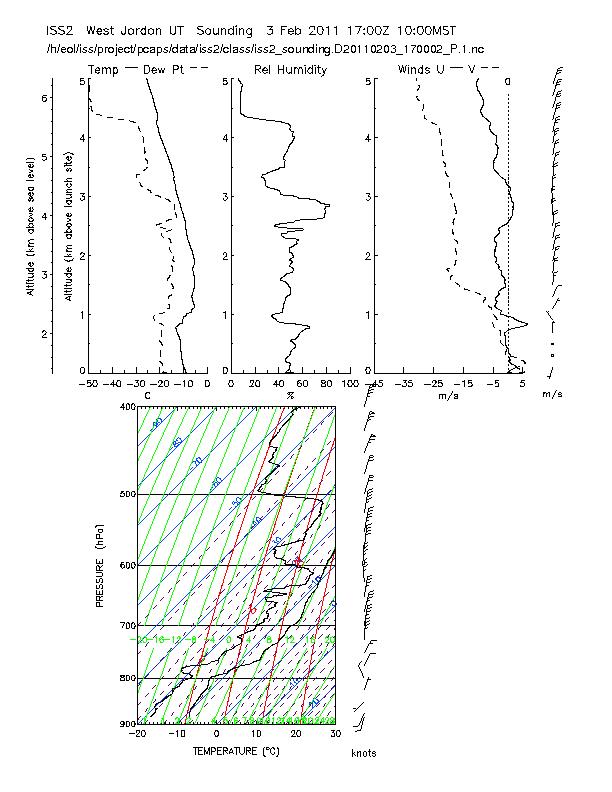
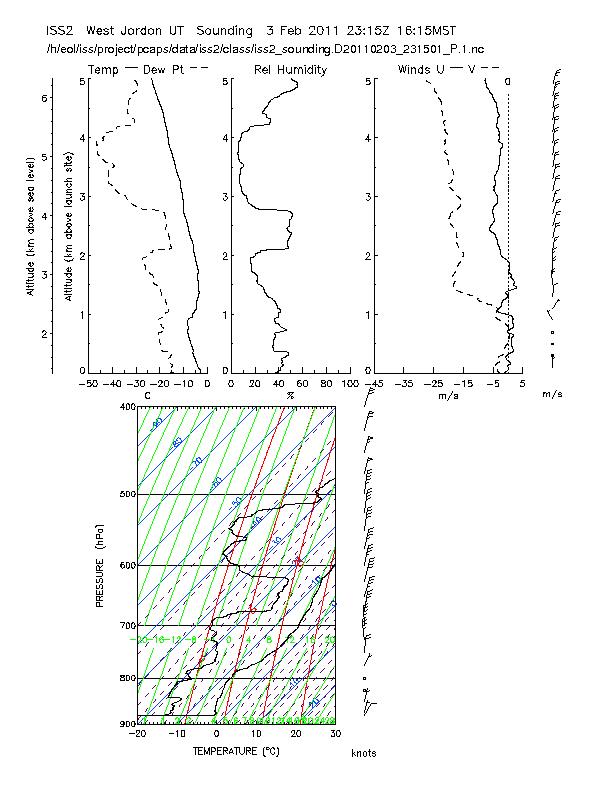
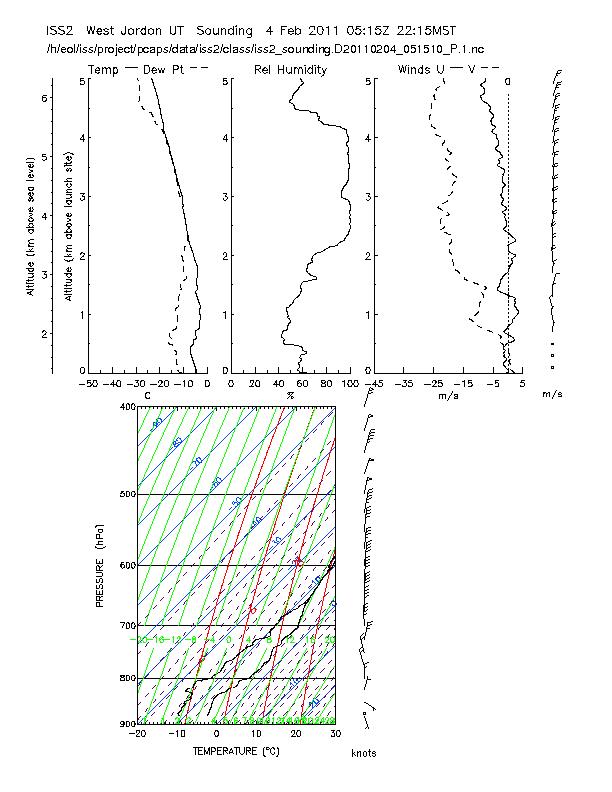
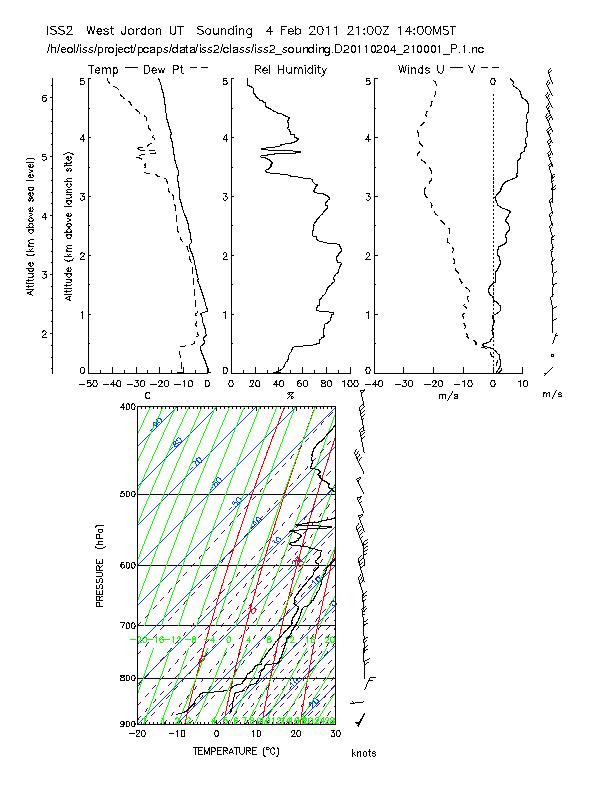
a Profile Plot in which parameters are plotted as a function of altitude up to 5 km (click on "Profile Plot").
Soundings
| ISS2 (PCAPS) | |
| 14-Oct-10 (day 287) | 15:32 UTC (08:32 MST) SkewT / Profile Plot |
| 14-Nov-10 (day 318) | 19:16 UTC (12:16 MST) SkewT / Profile Plot |
| 17-Nov-10 (day 321) | 16:40 UTC (09:40 MST) SkewT / Profile Plot |
| 02-Dec-10 (day 335) |
17:36 UTC (10:36 MST)
SkewT
/ Profile Plot
05:16 UTC (22:16 MST) SkewT / Profile Plot |
| 03-Dec-10 (day 336) |
17:14 UTC (10:14 MST)
SkewT
/ Profile Plot
05:14 UTC (22:14 MST) SkewT / Profile Plot 11:23 UTC (04:23 MST) SkewT / Profile Plot |
| 04-Dec-10 (day 337) |
17:16 UTC (10:16 MST)
SkewT
/ Profile Plot
05:13 UTC (22:13 MST) SkewT / Profile Plot |
| 05-Dec-10 (day 338) |
17:16 UTC (10:16 MST)
SkewT
/ Profile Plot
05:16 UTC (22:16 MST) SkewT / Profile Plot |
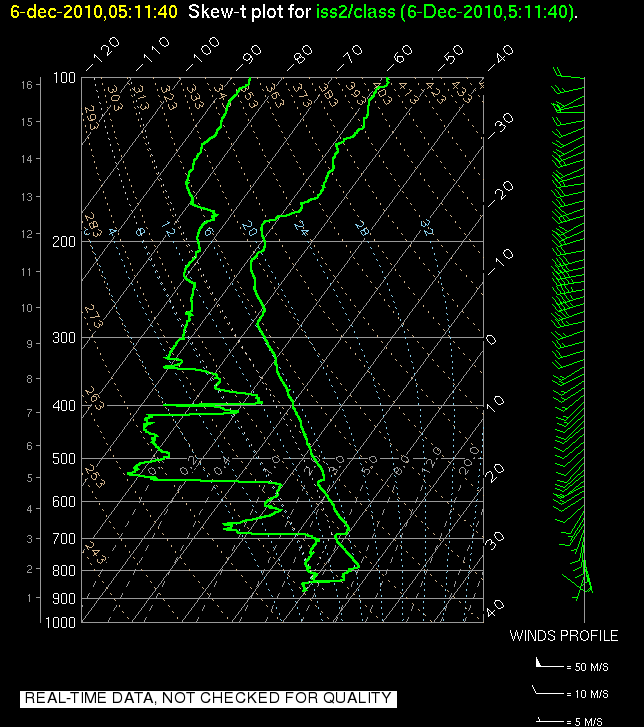
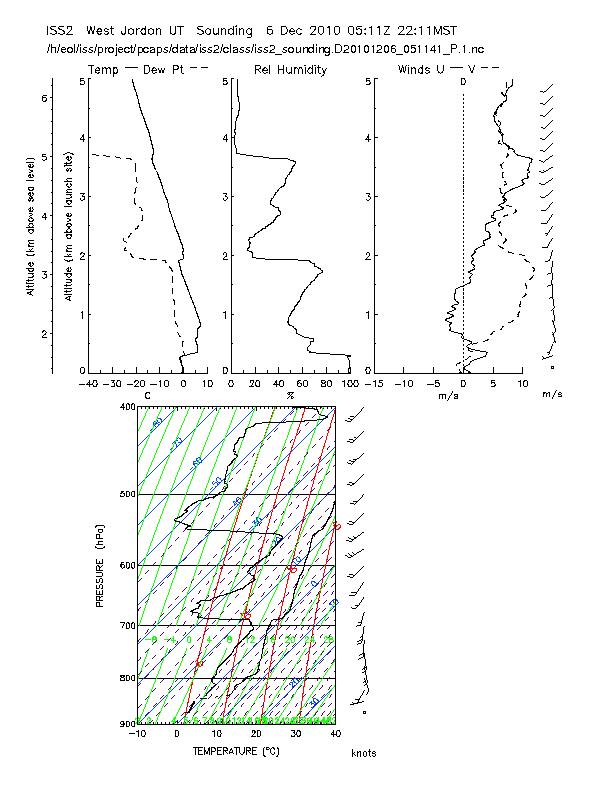
| 06-Dec-10 (day 339) |
17:36 UTC (10:36 MST)
SkewT
/ Profile Plot
05:11 UTC (22:11 MST) SkewT / Profile Plot |
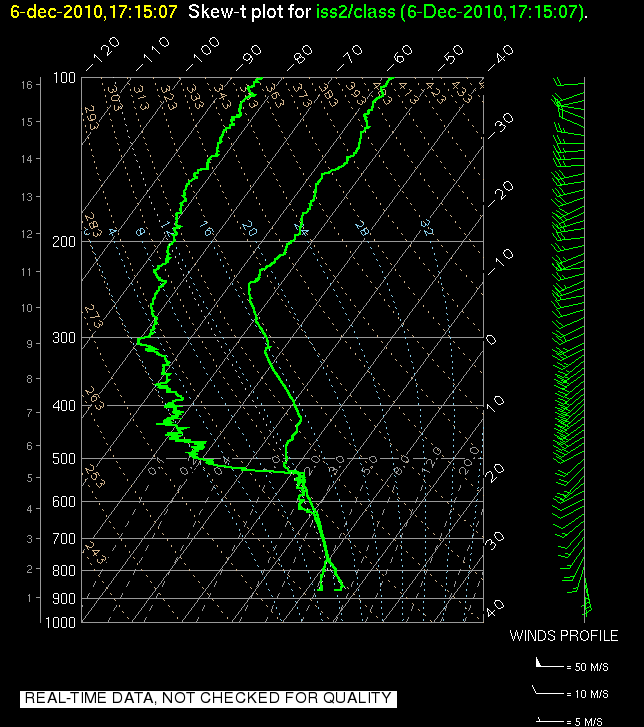
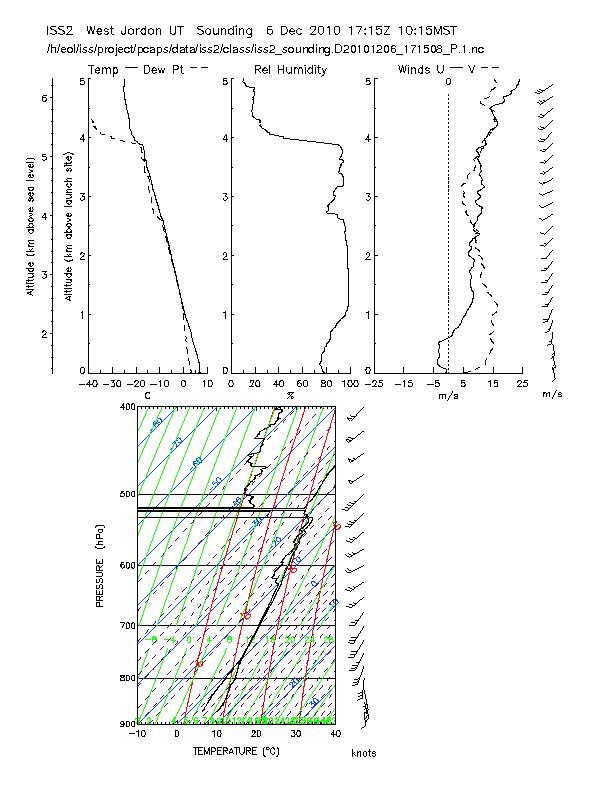
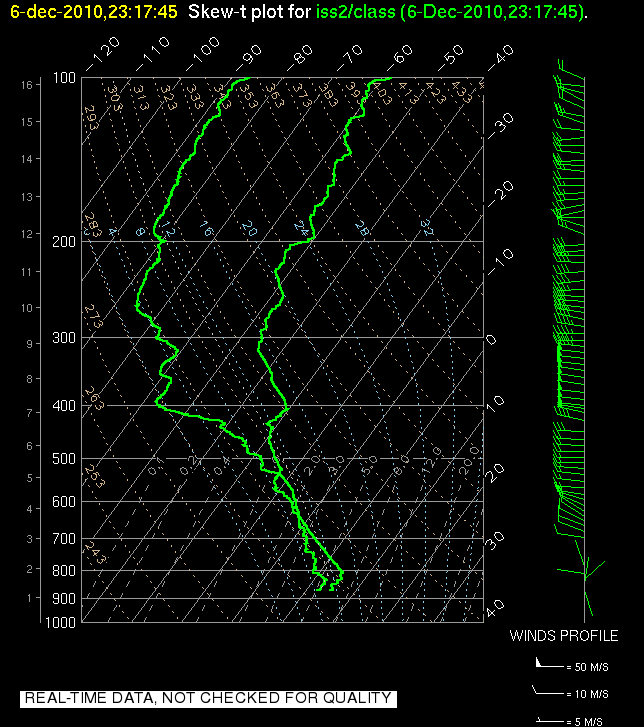
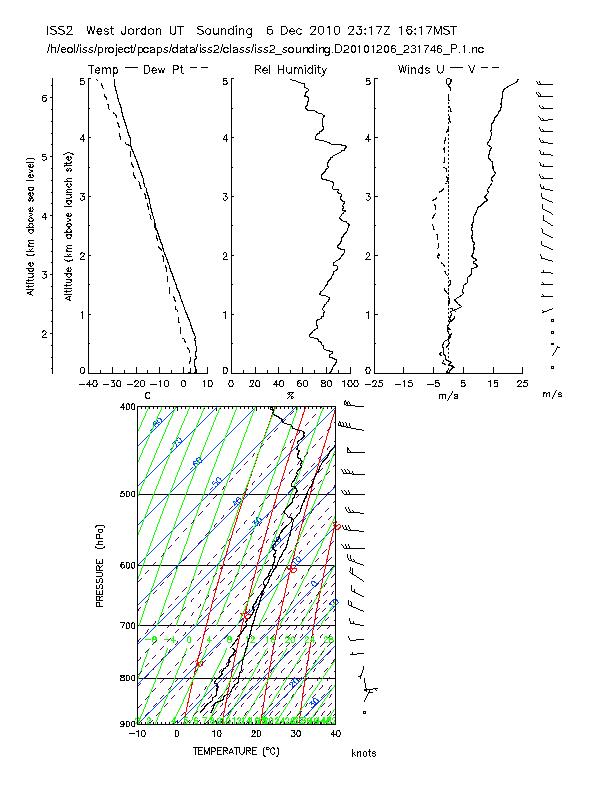
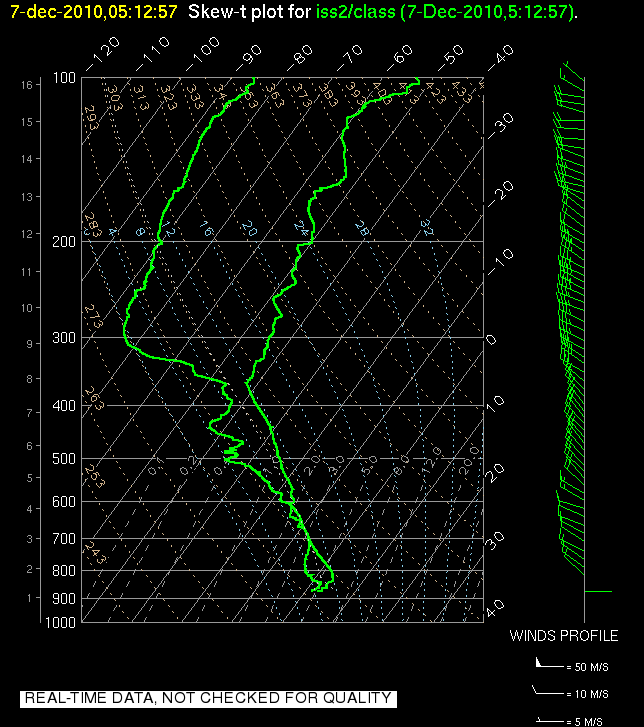
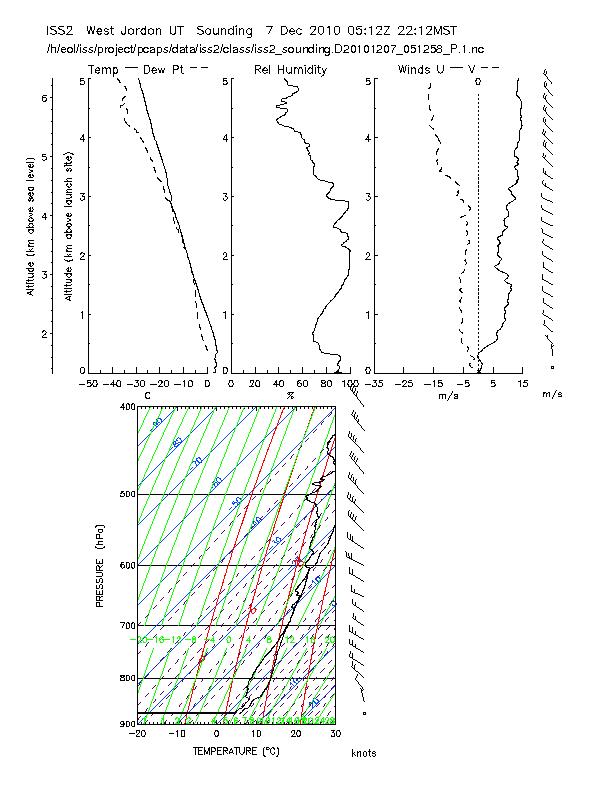
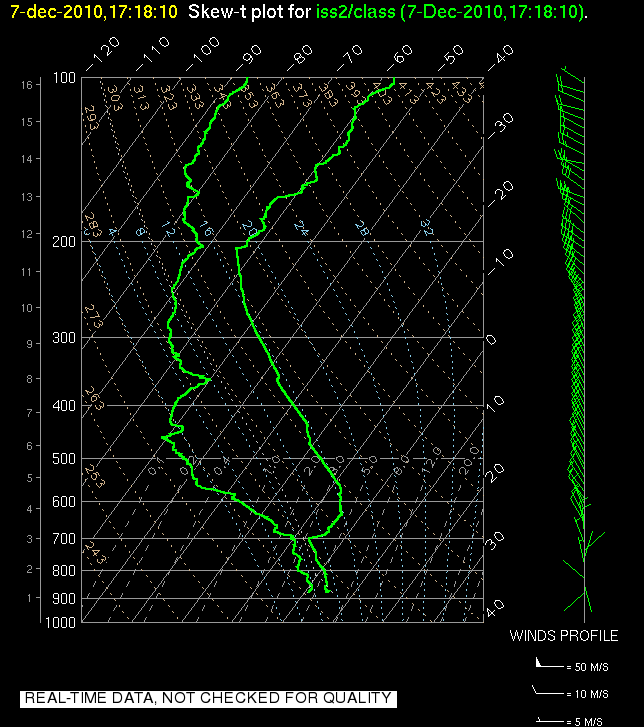
| 07-Dec-10 (day 340) |
17:15 UTC (10:15 MST)
SkewT
/ Profile Plot
23:17 UTC (16:17 MST) SkewT / Profile Plot 05:12 UTC (22:12 MST) SkewT / Profile Plot |
| 08-Dec-10 (day 341) |
17:18 UTC (10:18 MST)
SkewT
/ Profile Plot
05:14 UTC (22:14 MST) SkewT / Profile Plot |
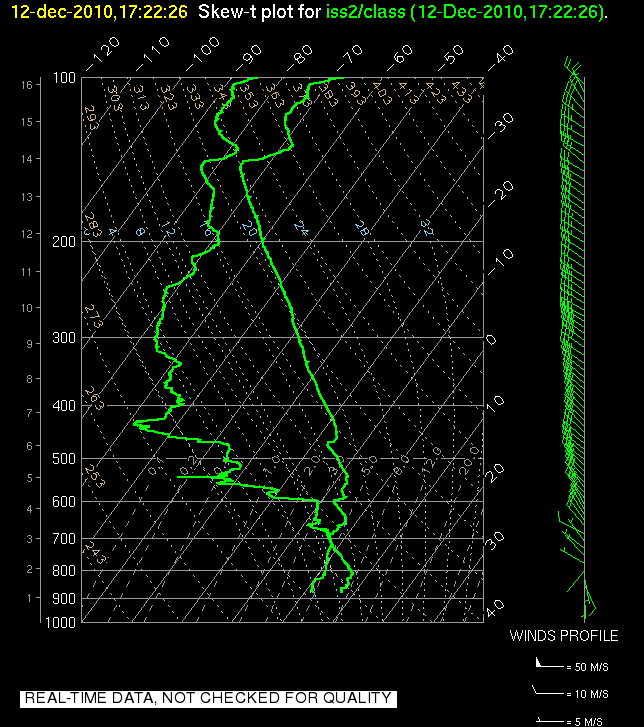
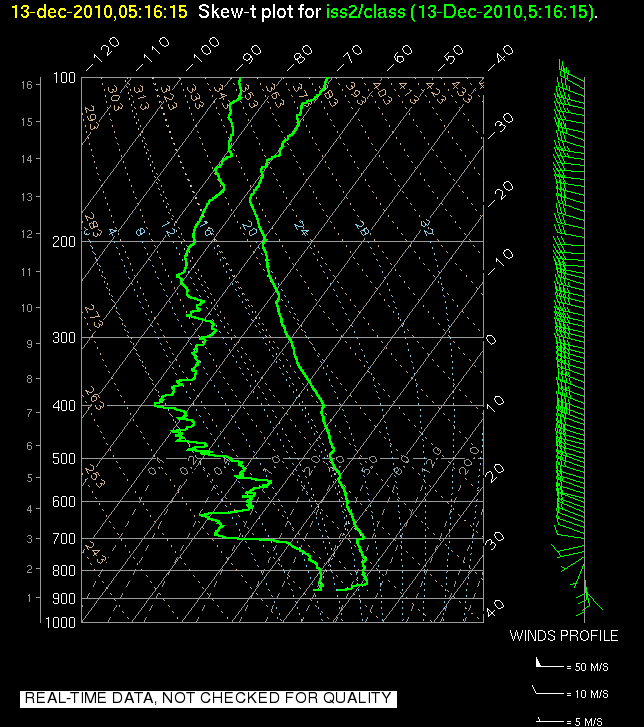
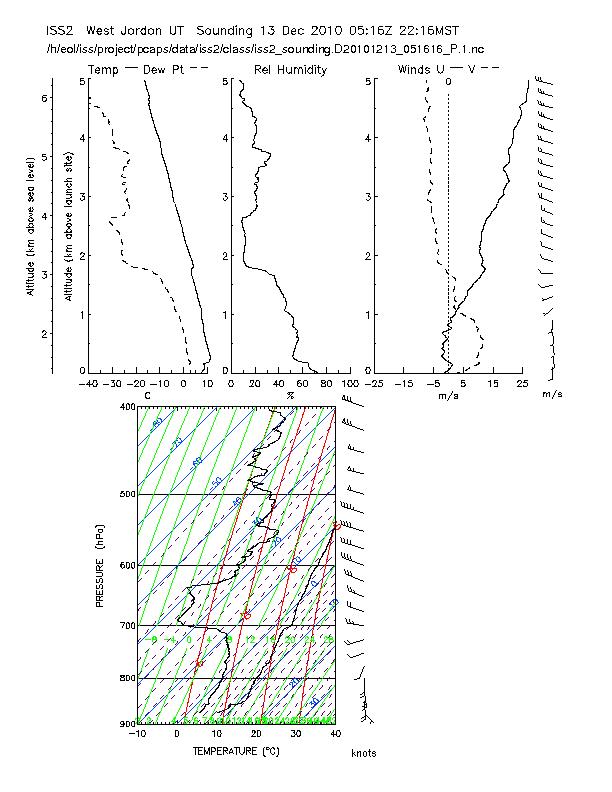
| 13-Dec-10 (day 346) |
17:22 UTC (10:22 MST)
SkewT
/ Profile Plot
05:16 UTC (22:16 MST) SkewT / Profile Plot |
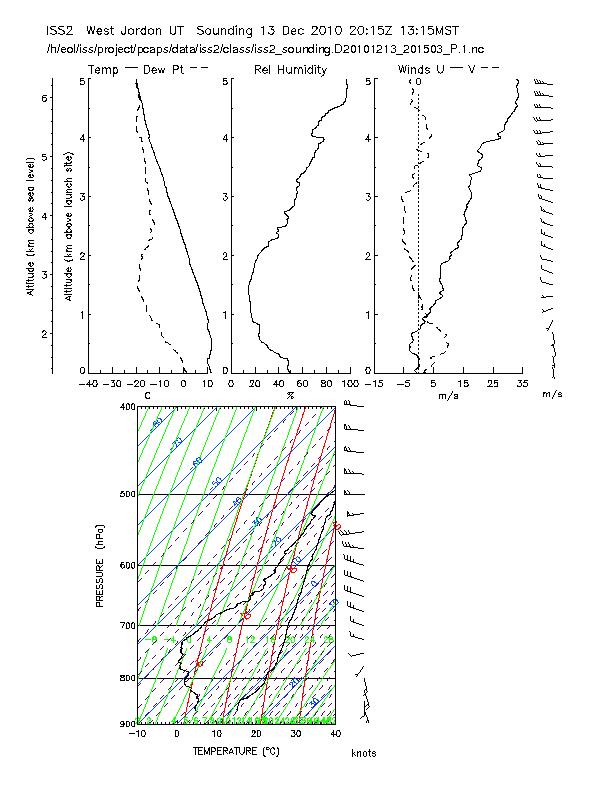
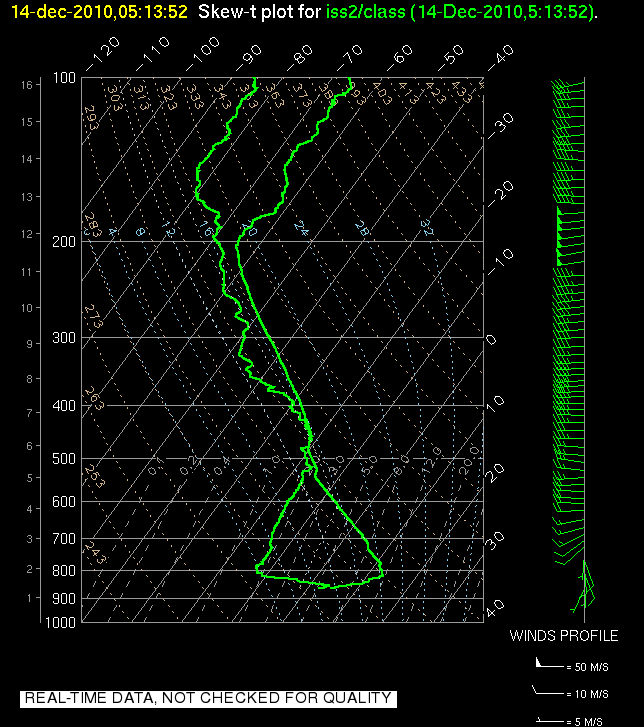
| 14-Dec-10 (day 347) |
20:15 UTC (13:15 MST)
SkewT
/ Profile Plot
05:13 UTC (22:13 MST) SkewT / Profile Plot 11:14 UTC (04:14 MST) SkewT / Profile Plot |
| 14-Dec-10 (day 348) |
17:13 UTC (10:13 MST)
SkewT
/ Profile Plot
20:15 UTC (13:15 MST) SkewT / Profile Plot |
| 24-Dec-10 (day 358) | 05:15 UTC (22:15 MST) SkewT / Profile Plot |
| 25-Dec-10 (day 358) |
17:14 UTC (10:14 MST)
SkewT
/ Profile Plot
05:17 UTC (22:17 MST) SkewT / Profile Plot |
| 26-Dec-10 (day 359) |
17:15 UTC (10:15 MST)
SkewT
/ Profile Plot
05:10 UTC (22:10 MST) SkewT / Profile Plot 11:14 UTC (04:14 MST) SkewT / Profile Plot |
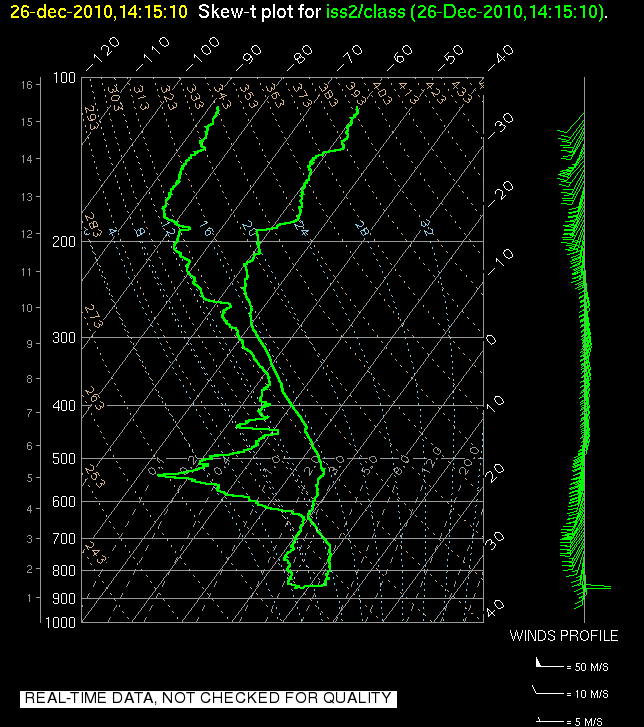
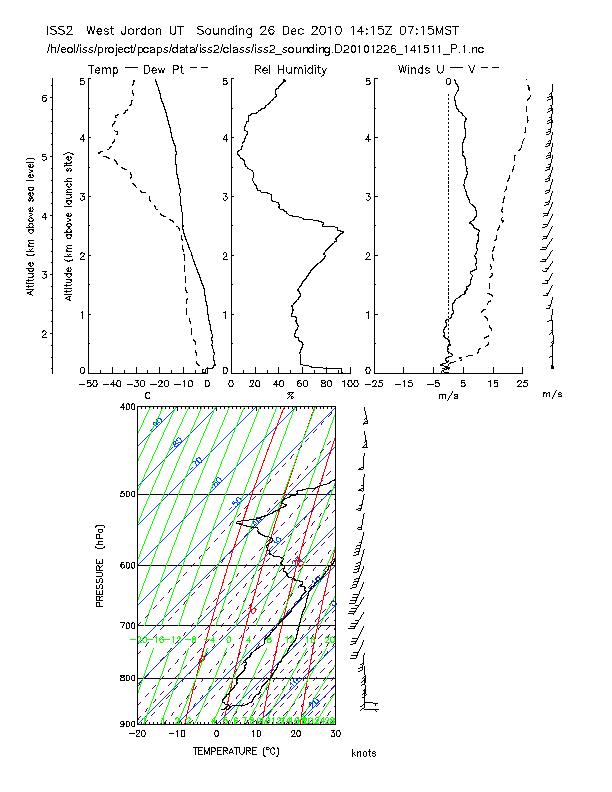
| 26-Dec-10 (day 360) |
14:15 UTC (07:15 MST)
SkewT
/ Profile Plot
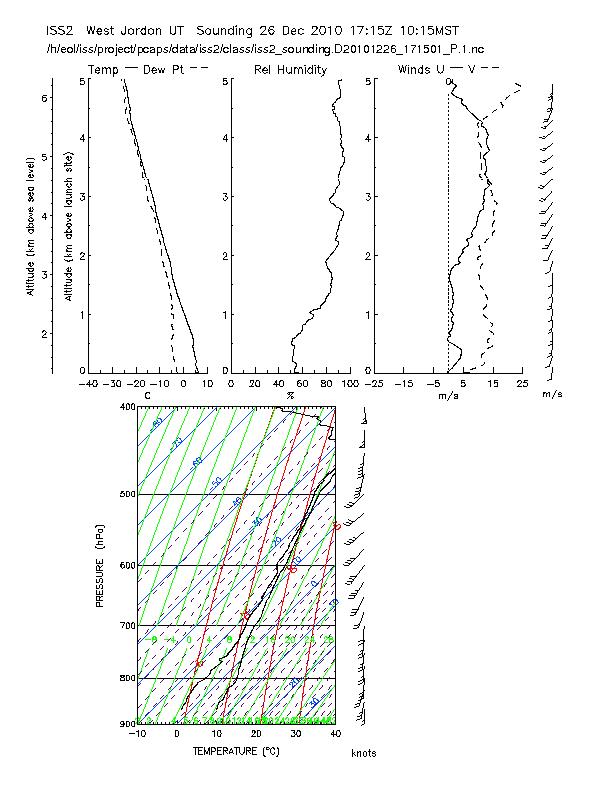
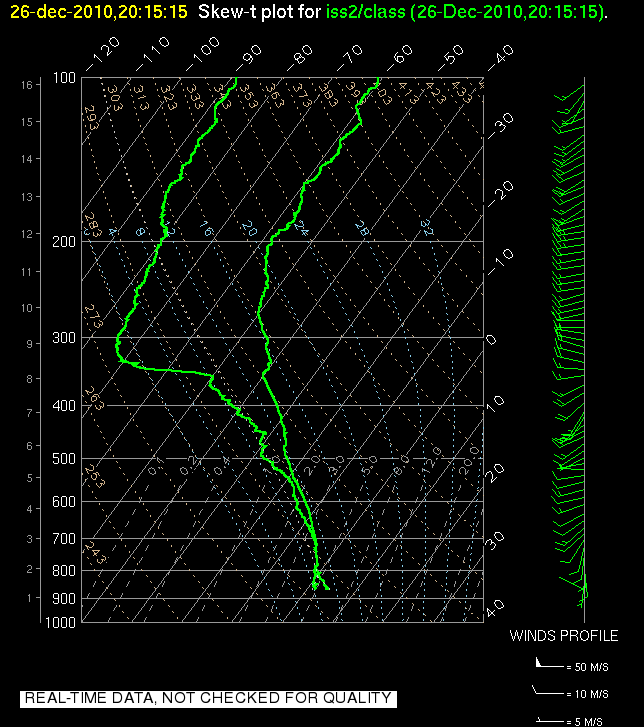
17:15 UTC (10:15 MST) SkewT / Profile Plot 20:15 UTC (13:15 MST) SkewT / Profile Plot |
| 01-Jan-11 (day 001) | 05:15 UTC (22:15 MST) SkewT / Profile Plot |
| 02-Jan-11 (day 001) |
17:14 UTC (10:14 MST)
SkewT
/ Profile Plot
05:22 UTC (22:22 MST) SkewT / Profile Plot |
| 03-Jan-11 (day 002) |
17:15 UTC (10:15 MST)
SkewT
/ Profile Plot
23:15 UTC (16:15 MST) SkewT / Profile Plot 05:27 UTC (22:27 MST) SkewT / Profile Plot 08:15 UTC (01:15 MST) SkewT / Profile Plot 11:15 UTC (04:15 MST) SkewT / Profile Plot |
| 04-Jan-11 (day 003) |
14:16 UTC (07:16 MST)
SkewT
/ Profile Plot
17:15 UTC (10:15 MST) SkewT / Profile Plot 20:15 UTC (13:15 MST) SkewT / Profile Plot 23:15 UTC (16:15 MST) SkewT / Profile Plot 02:16 UTC (19:16 MST) SkewT / Profile Plot 05:15 UTC (22:15 MST) SkewT / Profile Plot 08:15 UTC (01:15 MST) SkewT / Profile Plot 11:15 UTC (04:15 MST) SkewT / Profile Plot |
| 05-Jan-11 (day 004) |
17:16 UTC (10:16 MST)
SkewT
/ Profile Plot
23:15 UTC (16:15 MST) SkewT / Profile Plot 05:15 UTC (22:15 MST) SkewT / Profile Plot 11:23 UTC (04:23 MST) SkewT / Profile Plot |
| 06-Jan-11 (day 005) |
17:15 UTC (10:15 MST)
SkewT
/ Profile Plot
23:15 UTC (16:15 MST) SkewT / Profile Plot 05:14 UTC (22:14 MST) SkewT / Profile Plot 11:56 UTC (04:56 MST) SkewT / Profile Plot |
| 07-Jan-11 (day 006) |
17:15 UTC (10:15 MST)
SkewT
/ Profile Plot
23:15 UTC (16:15 MST) SkewT / Profile Plot 05:16 UTC (22:16 MST) SkewT / Profile Plot 11:14 UTC (04:14 MST) SkewT / Profile Plot |
| 08-Jan-11 (day 007) |
17:00 UTC (10:00 MST)
SkewT
/ Profile Plot
21:59 UTC (14:59 MST) SkewT / Profile Plot 05:15 UTC (22:15 MST) SkewT / Profile Plot 11:12 UTC (04:12 MST) SkewT / Profile Plot |
| 09-Jan-11 (day 008) |
17:15 UTC (10:15 MST)
SkewT
/ Profile Plot
20:15 UTC (13:15 MST) SkewT / Profile Plot 23:15 UTC (16:15 MST) SkewT / Profile Plot 02:14 UTC (19:14 MST) SkewT / Profile Plot 05:15 UTC (22:15 MST) SkewT / Profile Plot 08:16 UTC (01:16 MST) SkewT / Profile Plot |
| 12-Jan-11 (day 012) | 05:14 UTC (22:14 MST) SkewT / Profile Plot |
| 12-Jan-11 (day 012) | 17:15 UTC (10:15 MST) SkewT / Profile Plot |
| 14-Jan-11 (day 013) |
17:15 UTC (10:15 MST)
SkewT
/ Profile Plot
05:16 UTC (22:16 MST) SkewT / Profile Plot |
| 14-Jan-11 (day 014) | 17:15 UTC (10:15 MST) SkewT / Profile Plot |
| 15-Jan-11 (day 015) | 17:15 UTC (10:15 MST) SkewT / Profile Plot |
| 16-Jan-11 (day 016) | 17:12 UTC (10:12 MST) SkewT / Profile Plot |
| 17-Jan-11 (day 017) | 17:22 UTC (10:22 MST) SkewT / Profile Plot |
| 20-Jan-11 (day 020) | 17:13 UTC (10:13 MST) SkewT / Profile Plot |
| 27-Jan-11 (day 026) |
17:11 UTC (10:11 MST)
SkewT
/ Profile Plot
23:15 UTC (16:15 MST) SkewT / Profile Plot 05:15 UTC (22:15 MST) SkewT / Profile Plot 11:14 UTC (04:14 MST) SkewT / Profile Plot |
| 28-Jan-11 (day 027) |
17:00 UTC (10:00 MST)
SkewT
/ Profile Plot
22:02 UTC (15:02 MST) SkewT / Profile Plot 05:26 UTC (22:26 MST) SkewT / Profile Plot |
| 29-Jan-11 (day 028) |
13:57 UTC (06:57 MST)
SkewT
/ Profile Plot
17:11 UTC (10:11 MST) SkewT / Profile Plot 21:59 UTC (14:59 MST) SkewT / Profile Plot 05:13 UTC (22:13 MST) SkewT / Profile Plot |
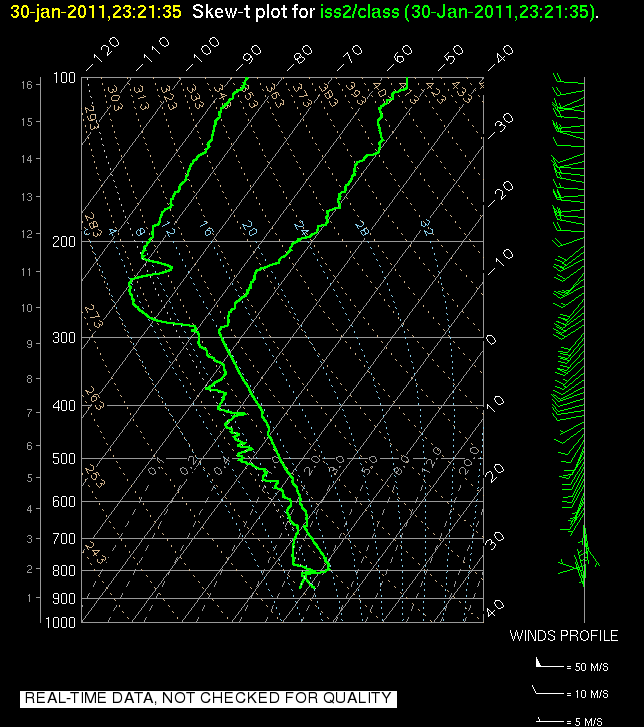
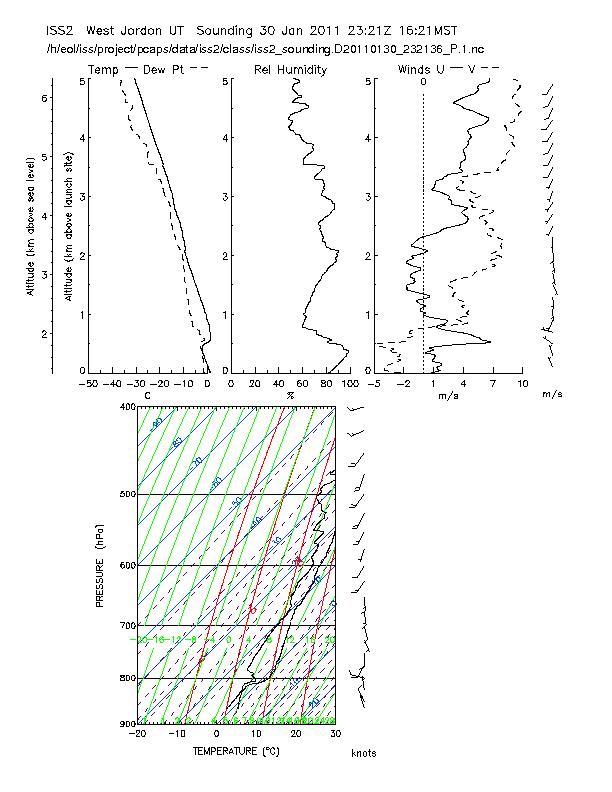
| 30-Jan-11 (day 029) |
17:10 UTC (10:10 MST)
SkewT
/ Profile Plot
21:59 UTC (14:59 MST) SkewT / Profile Plot 05:10 UTC (22:10 MST) SkewT / Profile Plot 11:14 UTC (04:14 MST) SkewT / Profile Plot |
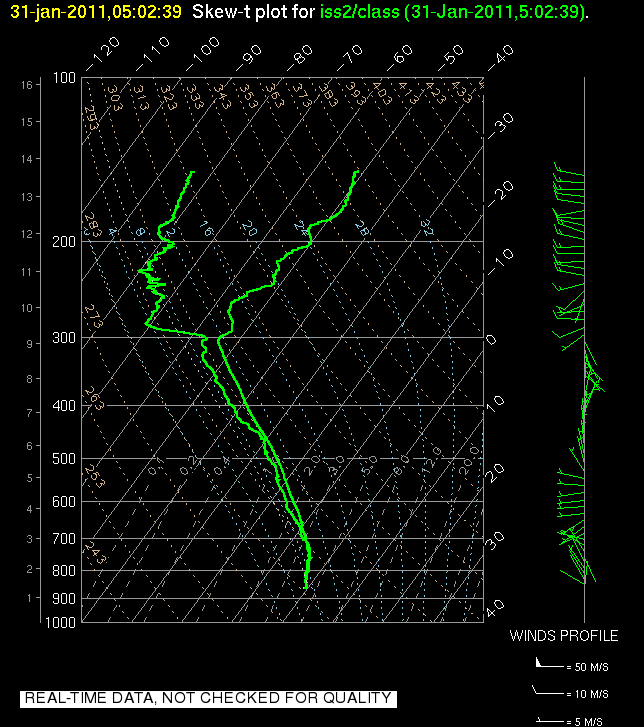
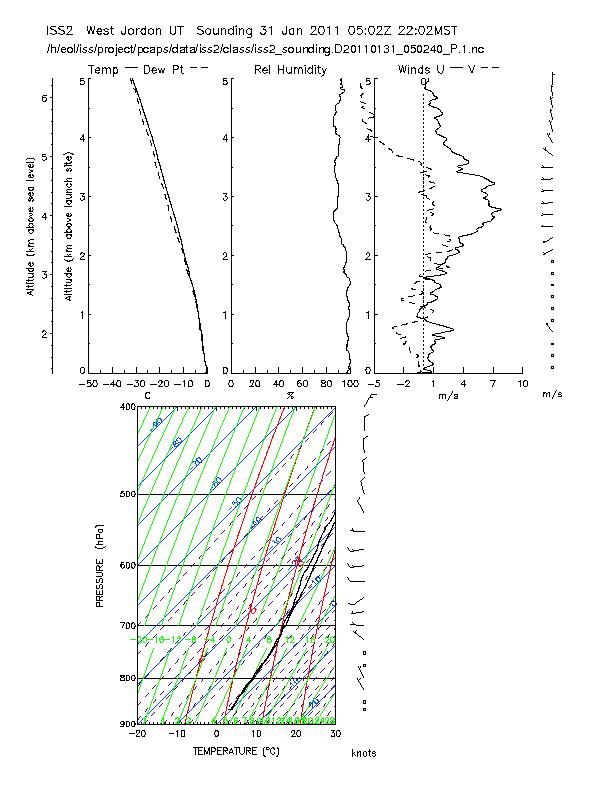
| 31-Jan-11 (day 030) |
14:14 UTC (07:14 MST)
SkewT
/ Profile Plot
17:15 UTC (10:15 MST) SkewT / Profile Plot 23:21 UTC (16:21 MST) SkewT / Profile Plot 05:02 UTC (22:02 MST) SkewT / Profile Plot |
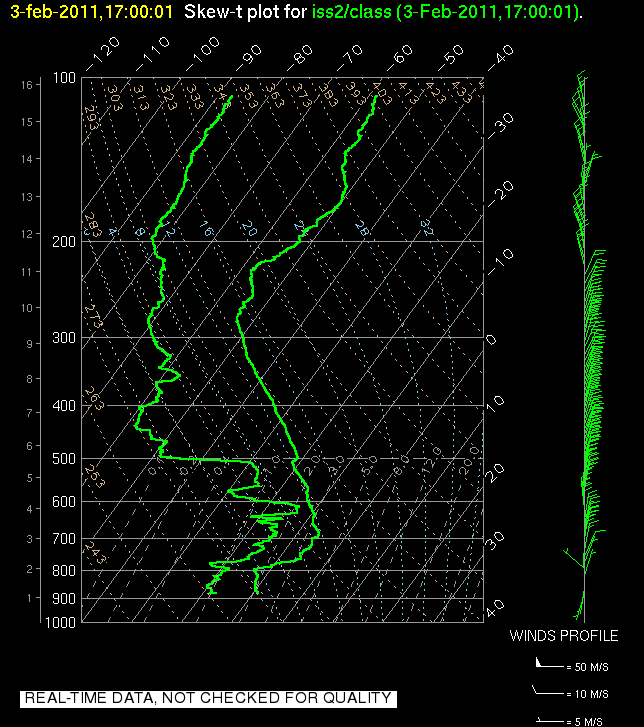
| 03-Feb-11 (day 033) |
17:15 UTC (10:15 MST)
SkewT
/ Profile Plot
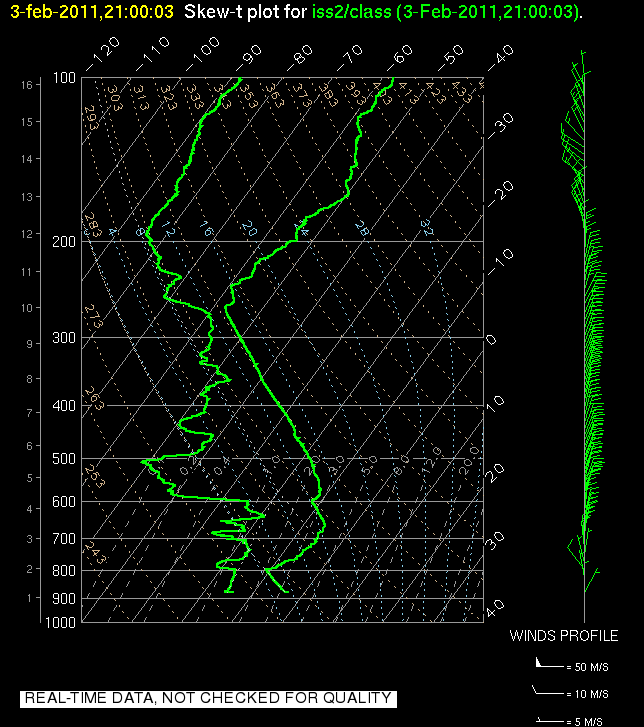
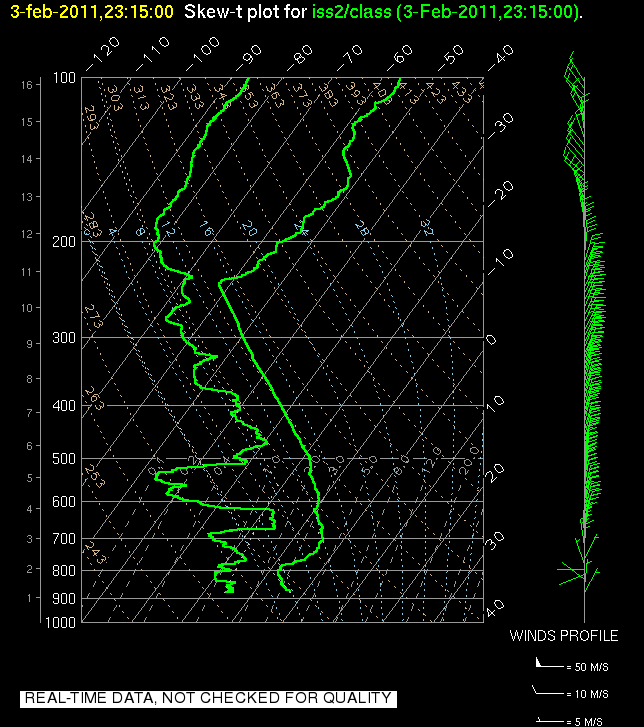
05:15 UTC (22:15 MST) SkewT / Profile Plot |
| 04-Feb-11 (day 034) |
17:00 UTC (10:00 MST)
SkewT
/ Profile Plot
21:00 UTC (14:00 MST) SkewT / Profile Plot 23:15 UTC (16:15 MST) SkewT / Profile Plot 05:15 UTC (22:15 MST) SkewT / Profile Plot |
| 05-Feb-11 (day 035) |
17:00 UTC (10:00 MST)
SkewT
/ Profile Plot
21:00 UTC (14:00 MST) SkewT / Profile Plot 23:15 UTC (16:15 MST) SkewT / Profile Plot 05:16 UTC (22:16 MST) SkewT / Profile Plot |
| Count n= 111 | 0 |
Plots are updated about 15 minutes past the hour after the flight is completed.
Note that one or two soudings may be missing due data close-out errors;
the raw data for these was recorded however plots may not be available until post-processing is completed.
The SkewT sounding plots are also available on the : ISS Skew-T plots and PCAPS ISS2 data pages.
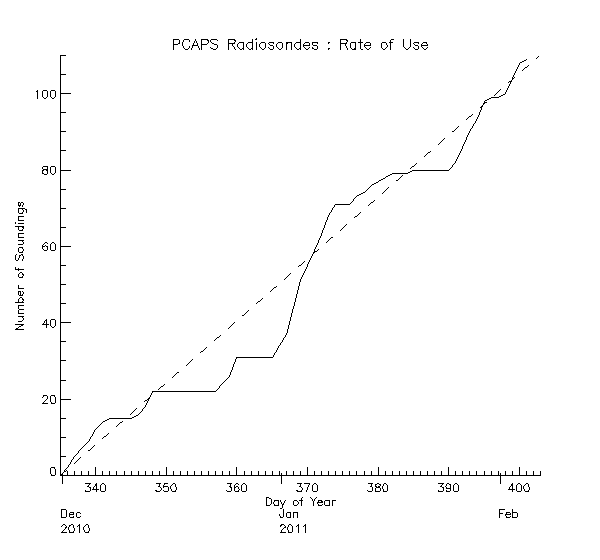
A plot showing the rate of use of radiosondes is available here.