


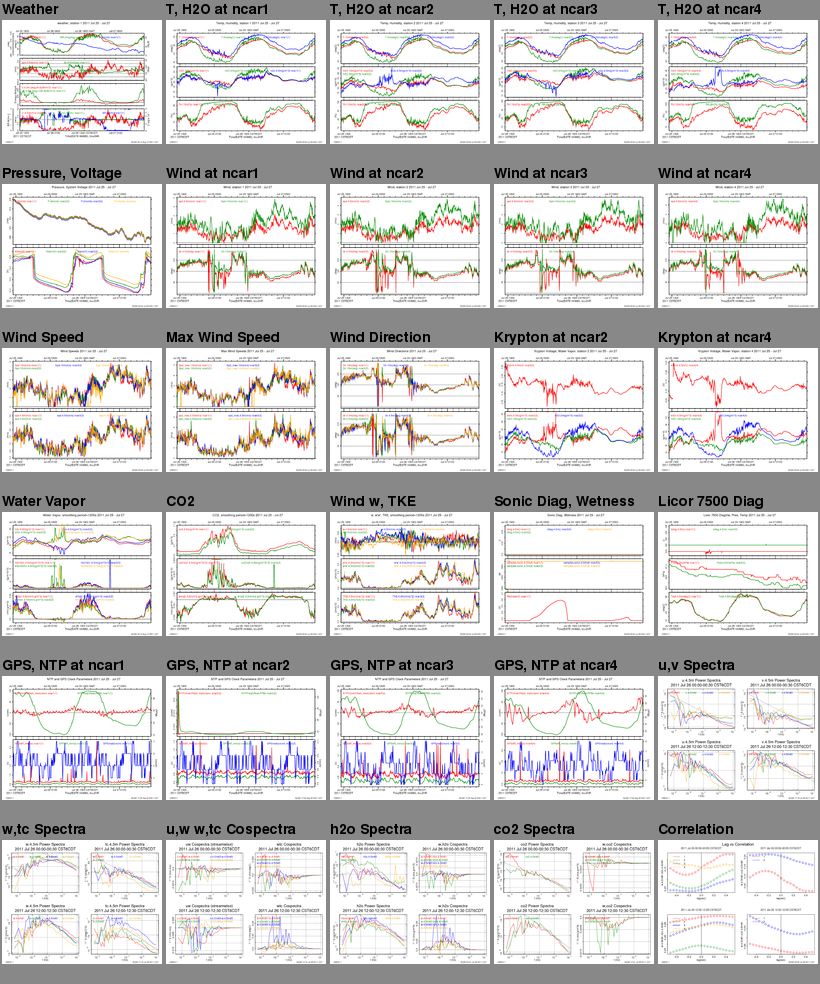
CWEX11 ISFS Daily Plots, Jul 26, 2011
These are preliminary QC plots of some of the 5 minute statistics from the CWEX11 project.
The data have not been checked or edited. Note that the labels on the top of the time series plots are in GMT, and the bottom labels are in Central Daylight (local) time. Click on a plot image to expand.
If you right-click on an image, most
browsers will provide a menu to download or display the plot
in another window.
Last modified: Friday, 2-Sep-2011
© NCAR/Earth Observing Laboratory
NCAR In situ Sensing Facility