Last Revision: May 24, 2010
A Comparison of HIPPO Research In Situ Temperatures to Radiosondes
MJ Mahoney, Jet Propulsion Laboratory (JPL), Pasadena, CA
and
Julie Haggerty, National Center for Atmospheric Research (NCAR), Boulder, CO
The calibration of the NSF/NCAR Gulfstream-V (NGV) Microwave Temperature Profiler (MTP) is simplified if an in situ temperature measurement made during HIPPO is first calibrated against radiosondes launched near the NGV flight track. This calibration is then transferred to the MTP data when it is processed. This note discusses the analysis we performed to calibrate the MTP data.
Introduction
Because radiosondes (RAOBs) provide well-characterized temperature profiles of the Earth's atmosphere, they provide a convenient, albiet tedious, method for calibrating Microwave Temperature Profiler (MTP) measurements made upon an airborne research platform. The JPL MTP group has used this calibration technique for many year with excellent results. For example, on NASA DC-8 field campaigns over a period of several years we found that the DADS/ICATS outside air temperature measurement had a consistent warm bias of ~0.8 K1. No one was responsible for this measurement from the Navigation Data Recorder, so the calibration was never changed. We have also been on field campaigns where we have used preliminary PI-led temperature measurements in the calibration process, and come up with a temperature calibration consistent with the final archived PI temperature data. For example, we found that during the CRAVE field campaign in Costa Rica aboard the NASA WB-57 that the Dryden Flight Research Center MMS preliminary temperature measurement (when compared to radiosondes) had a warm bias of +0.44 K (Tmms = Traob + (0.44 ± 0.22) K for 17 comparisons. When the final MMS data was submitted to the CRAVE ESPO archive, the PI stated2 that "Tstatic is lowered by some 0.4 to 0.5 K compared to the preliminary data", which was exactly in agreement with the MTP assessment of the preliminary MMS data.
We have used our calibration technique to assess in situ temperature measurements from two prior NCAR/NSF Gulfstream-V (NGV) field campaigns -- T-Rex3 and START-084 -- and have found significant differences between the four in situ temperature measurements made during these campaigns. More details on how the RAOB comparisons are done can be found on web page describing the START-08 analysis4.
The MTP did not participate in T-Rex, but we were able to modify the MTP data analysis code to perform flight level only comparisons with radiosondes. Because Leeds University launched radiosondes frequently from Independence, CA, during the NGV flights, we were able to obtain 648 close approaches to the launch site, about an order of magnitude more possible comparisons than on most continental field campaigns. We used only two of the four in situ temperature measurements for these comparisons: the avionics temperature (AT_A) and one of the heated research temperature probles (ATHR1). What we found was that the research temperature (ATHR1) had a warm bias (compared to radiosondes) of 2.5 - 3.0 K, and that the avionics temperature (AT_A) had a pressure altitude dependent warm bias: ~1 K at 8.5 km and ~2 K at 12.5 km3.
Table I. Temperature measurements that are available on the NGV
| NCAR Temperature Parameter | Parameter Name Here | Comment |
| AT_A | AT_A | Ambient Temperature from the Air Data Computer (ADC) |
| ATFR | ATFR | Ambient Temperature - Fast Response (Unheated Probe, Left, Research Temperature) |
| ATHR1 | ATHR1 | Ambient Temperature - Heated Probe Right #1 (Research Temperature) |
| ATHR2 | ATHR2 | Ambient Temperature - Heated Probe Right #2 (Research Temperature) |
| - | Tmtp | MTP-derived outside air temperature |
| - | Traob | RAOB-derived outside air temperature |
For START-08 we did comparisons using all four in situ temperature measurements: AT_A, ATFR, ATHR1, and ATHR2. They are described in Table I. What we found were the following: AT_A-Traob = 1.74 ± 0.21 K, ATFR-Traob = 0.58 ± 0.19 K, ATHR1-Traob = 0.43 ± 0.20 K, and ATHR2-Traob = -0.03 ± 0.19 K. Because ATHR2 did not have a statistically significant bias, we performed three additional types of comparisons, and the result held up. ATHR2 was used as the correct outside air temperature. While the population standard deviation for each of these four comparisons was nearly 2 K in each case, the formal error on the temperature bias is only ~0.20 K. Note that the avionics temperature AT_A has the poorest accuracy. Within the errors, this result is identical to what we found during T-Rex3. However, during T-Rex we found that the temperature bias for AT_A was pressure altitude dependent, being nearly 2 K at 12.5 km and about 1 K at 8.5 km. Since the average altitude for these START-08 comparisons was 12.0 km, the 1.74 K bias compared to Traob is completely consistent with the T-Rex results at 12.5 km. On the other hand, the T-Rex reseach temperature (ATFR) showed a temperature error of 2.5-3.0 K, while during START-08 the error had dropped to 0.58 K. It is unclear what this means, since we don't know whether recovery factors and other corrections to the "research" temperatures were changed between the two campaigns.
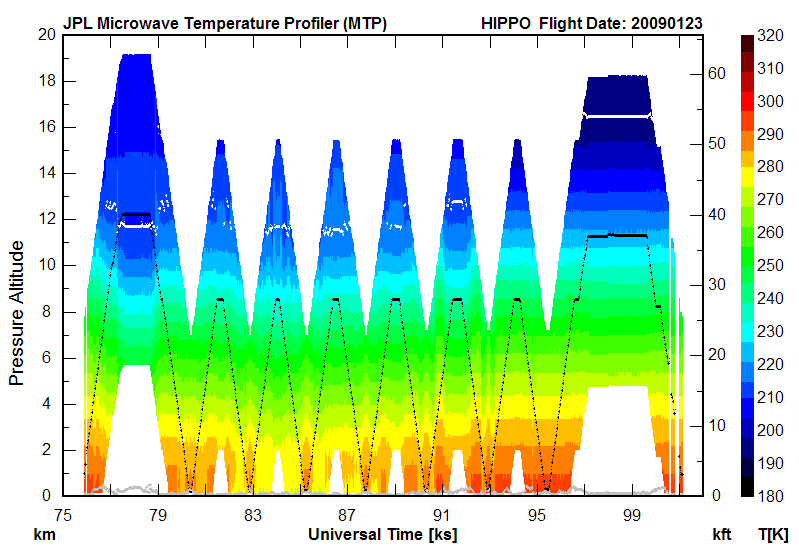
Figure 1. Color-coded Temperature Curtain (CTC) for the flight from New Zealand to Tahiti on January 23, 2009. The black trace is the NGV altitude, the white trace the tropopause altitude, and the gray trace at the bottom is a retrieval quality metric. The retrieval range shown is greater than desired (nominally +/- 4 km) so that the tropopause altitude could be seen.
Special Considerations for HIPPO
Except for the flights over Central and North America, most of the HIPPO flights were over oceans, which are notoriously radiosonde sparse. This presents a potential problem for calibration because having limited radiosondes means poorer statistics for the radiosonde comparisons. To overcome this radiosonde deficiency, we initially planned on using COSMIC satellite soundings. We downloaded all of the COSMIC soundings near the NGV flight track, and modified programs to handle the new sounding format. More on this later.
A potentially more serious issue was the fact that the NGV flew very few long level flight segments; for the most part, it was continuously profiling from the surface to a nominal cruise altitude, but not cruising very long! (see Figure 1) This presents issues for the MTP, because the MTP retrievals assume that during the coarse of a scan (~20 seconds) the pressure altitude does not change significantly. To make the most of the MTP measurements, we decided to down-weight the MTP measurements at the highest and lowest elevation angles, so that they contributed less information to the retrieved temperature profiles. This has the effect of reducing the effective pressure altitude change during the course of a scan. Because of this, results are presented over a more restricted altitude range than we would use for level flight.
A second issue related to the change in pressure altitude during rapid descents and ascents is the impact it has on comparison accuracy. The high lapse rate in the troposphere means that pressure altitude changes will have a larger error when comparisons are done. Histrorically, we have avoided doing calibration comparisons in the troposphere (because of the high lapse rate) and near the tropopause (because of the variability). However, during the Costa Rica Aura Validation Experiment (CRAVE) we flew extensively over the ocean on the WB-57, which every time it landed would do a slow spiral descent from altitude over Juan Santamaria Airport, where campaign radiosondes were launched every six hours. Since we had no other option for doing radiosonde comparisons, we used these tropospheric comparisons, and they worked very well. So, following the sage advice "when given lemons, make lemonade," that's what we did; we used the tropospheric data.
Normally when radiosonde comparisons are done, we do them at the time the aircraft is closest to a launch site. This did not provide enough comparisons to get good statistics. So instead of using the time of closest approach, we simply did comparisons on every dip in 2 km steps from the surface: 2, 4, 6, 8, 10, and 12 km, on both descent and ascent. This increased the number of possible comparisons by an order of magnitude.
Although we ultimately calibrate the MTP temperatures using radiosonde comparisons, the whole process is made much easier if we can use an in situ temperature measurement to transfer the calibration. That is, we process the data assuming that an in situ temperature measurement is accurate, compare the in situ temperatures to radiosondes, remove any bias that the in situ temperature might have. We then re-calibrate the MTP gain, reprocess the data, and verify that any bias in the in situ temperature has been removed.
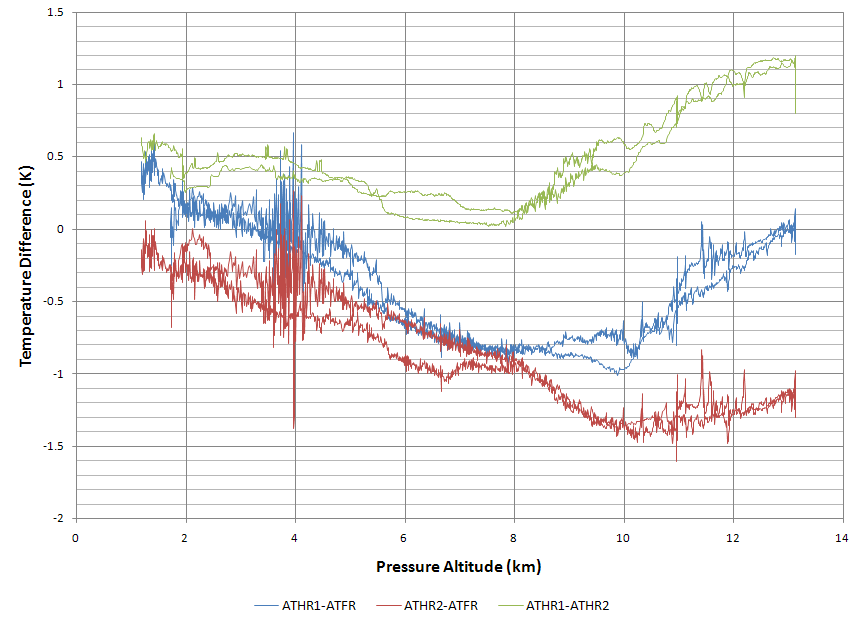
Figure 2. The differences of the three NGV research temperatures: ATFR, ATHR1, and ATHR2, for the HIPPO flight of 20090108.
The HIPPO In Situ Temperature Measurements
The readily available HIPPO archive data did not include the avionics temperature (AT_A) -- just the three research temperatures. The differences of these temperatures are shown in Figure 2 for the short flight out of RMMA on January 8, 2009. This is instructive, for by noticing that ATHR1-ATHR2 does not have the same "noise" at 4 km and looks like the eyeball difference between the other two curves (ATHR1-ATFR and ATHR2-ATFR), and suggests that ATFR is a better behaved temperature. For this rather weak reason, we chose to use ATFR as the in situ temperature to compare to radiosondes. (We could have used any of the research temperatures; it wouldn't make any difference in the end.)
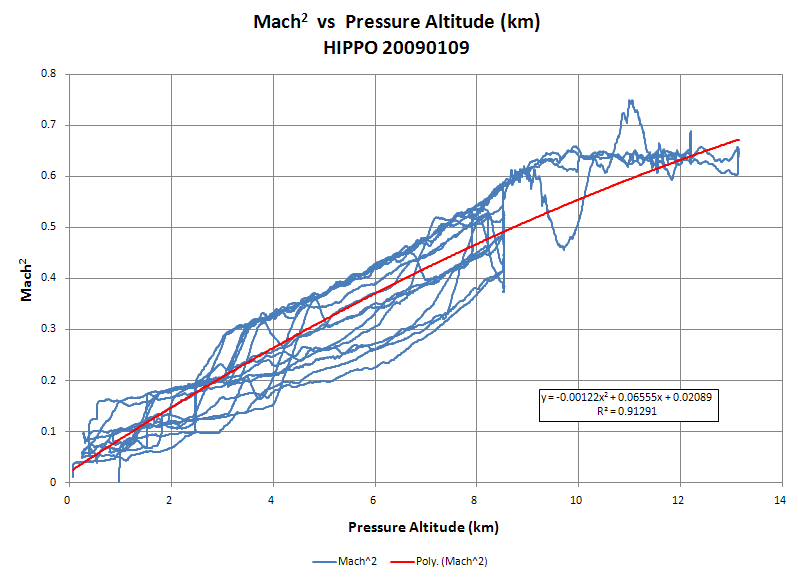
Figure 3. A fit for Mach Number squared versus pressure altitude (Zp): M2(Zp) = 0.02089 + 0.06555 Zp - 0.00122 Zp2
When the recovered temperature (Tr) from an in situ temperature probe is converted to a static temperature (Ts), two things are needed: the recovery factor (r) and the Mach Number (M). This is expressed by the equation:
![]()
the derivation of which is discussed elsewhere5. Therefore, to facilitate the data analysis, we needed to come up with an expression for Mach Number squared as a function of pressure altitude. (Mach Number is not normally used in the data analysis programs; pressure altitude is.) We chose the 20090109 flight to get a full range of pressure altitudes (i.e., down to sea level). A fit to Mach Number squared is shown in Figure 3.
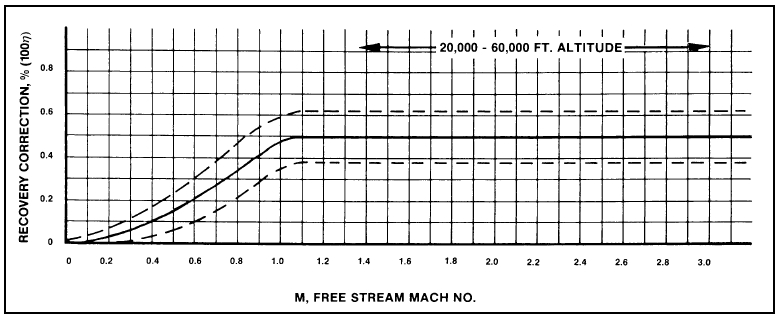
Figure 4. The recovery correction, which is related to the recovery factor, as a function of Mach Number6.
An important point to be noted about the HIPPO flights is that they involved extensive profiling of the troposphere. This immediately means that the recovery factor will have a Mach Number dependence (see Figure 4) which must be taken into account. In fact, the three research temperatures on the NGV used the following recovery factors for ATFR (r=0.995), ATHR1 (r=0.985), and ATHR2 (r=0.96). It is not clear why these recovery factors are different other than that this produced the best agreement between the three temperatures, which as shown in Figure 2 was not very good. In fact, when we compared the research temperatures to radiosondes, there was an obvious, albeit weak, pressure altitude (i..e., Mach Number) dependence.
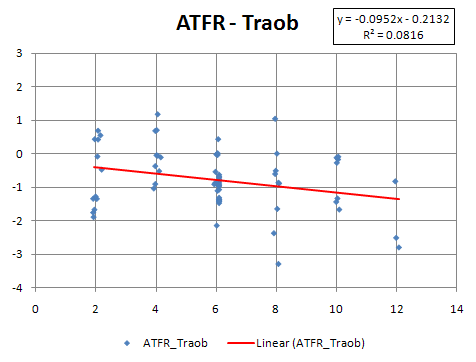
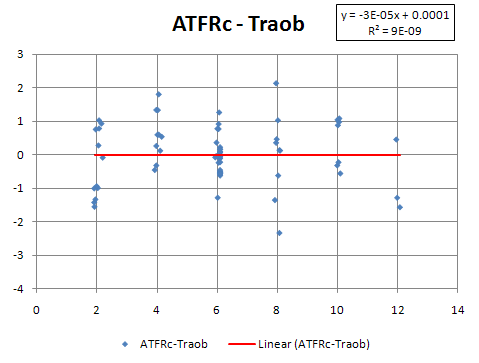
Figure 5. (Left) ATFR - Traob versus pressure altitude, and ATFRc - Traob versus pressure altitude (right).
This is shown in Figure 5. We assumed that the corrected ATFR, ATFRc, was given by: ATFRc = ATFR * (1 + k1 * M2) + k2, where k1 (=0.0096) and k2 (=-0.06) are constants. The M2 dependence was motivated by equation (1), and M2 is given by the equation in Figure 3. Clearly the cold bias of ATFR and its pressure altitude dependence in the left panel of Figure 5 is completely removed in the right panel. To be more numerical, we find for the biases in the temperature differences: ATFR-Traob = -0.77 ± 0.11 K (N=69), and ATFRc-Traob = 0.00 ± 0.10 K (N=69).
Conclusions
We have removed the pressure altitude dependent bias from ATFR to calculate ATFRc, the corrected fast response research temperature. This was used, together with the MTP reference target temperature, to calculate the MTP gain. It is very likely that a slightly better correction could have been made had we used Mach Number in processing the data instead of pressure altitude, for the simple reason that there is not a strict relationship between Mach Number and pressure altitude, while there is a strict relationship between Mach Number (and recovery factor) and static temperature.
References
1. MJ Mahoney, CAMEX-4 Temperature Intercomparisons, November 4, 2002.
2. MJ Mahoney, Microwave Temperature Profiler (MTP) Measurements for CRAVE, CRAVE Science Workshop, Lanham-Seabrook, MD, Nov 14-17, 2006. Also, http://mtp.mjmahoney.net/www/missions/crave/science/CRAVE_InSitu_T_Comparisons.html
3. MJ Mahoney and Julie Haggerty, A Comparison of T-Rex Avionics and Research In Situ Temperatures to Radiosondes, December 4, 2007.
4. MJ Mahoney and Julie Haggerty, A Comparison of START-08 Avionics and Research In Situ Temperatures to Radiosondes, February 9, 2009.
5. MJ Mahoney, In Situ Aircraft Temperature Measurement, September 16, 2002.
6. Truman M. Stickney, Marvin W. Shedlov, Donald I. Thompson, Goodrich Total Temperature Sensors, Technical Report 5755, Revision C, Rosemount Aerospace Inc., 1994.


